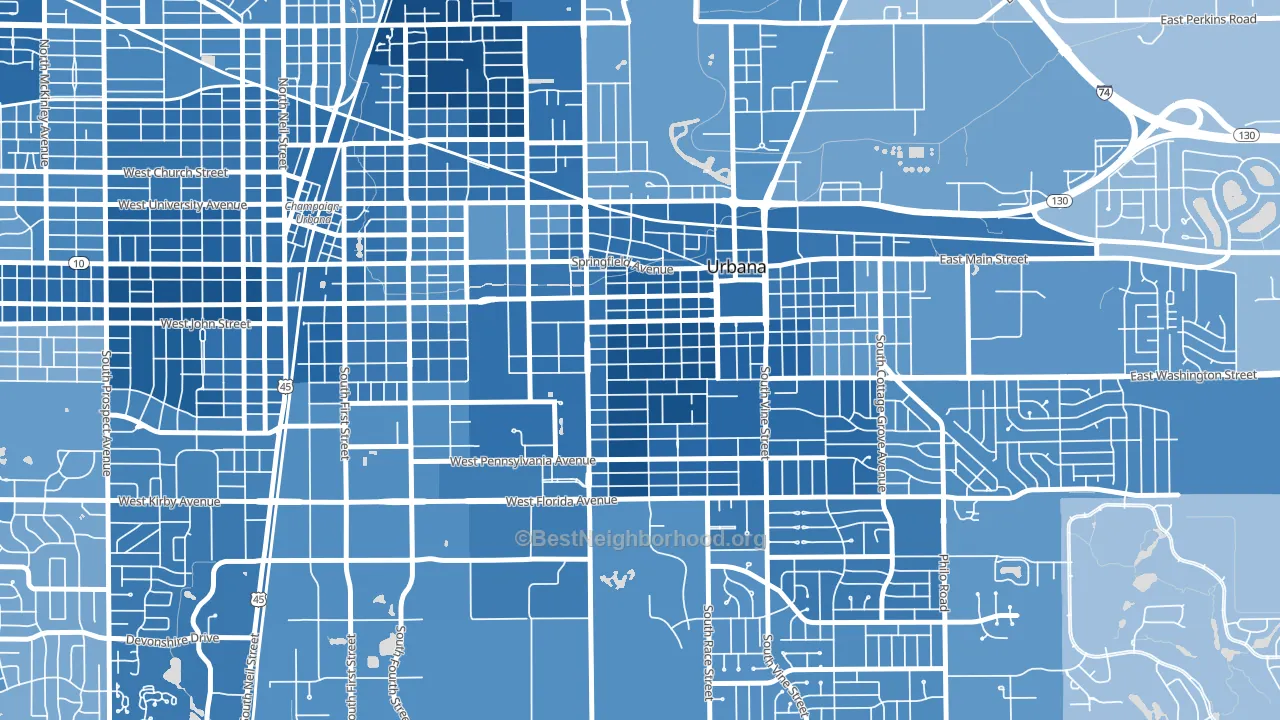
West Urbana is a Democratic stronghold. About 86% of voters here vote Democratic and 14% Republican.
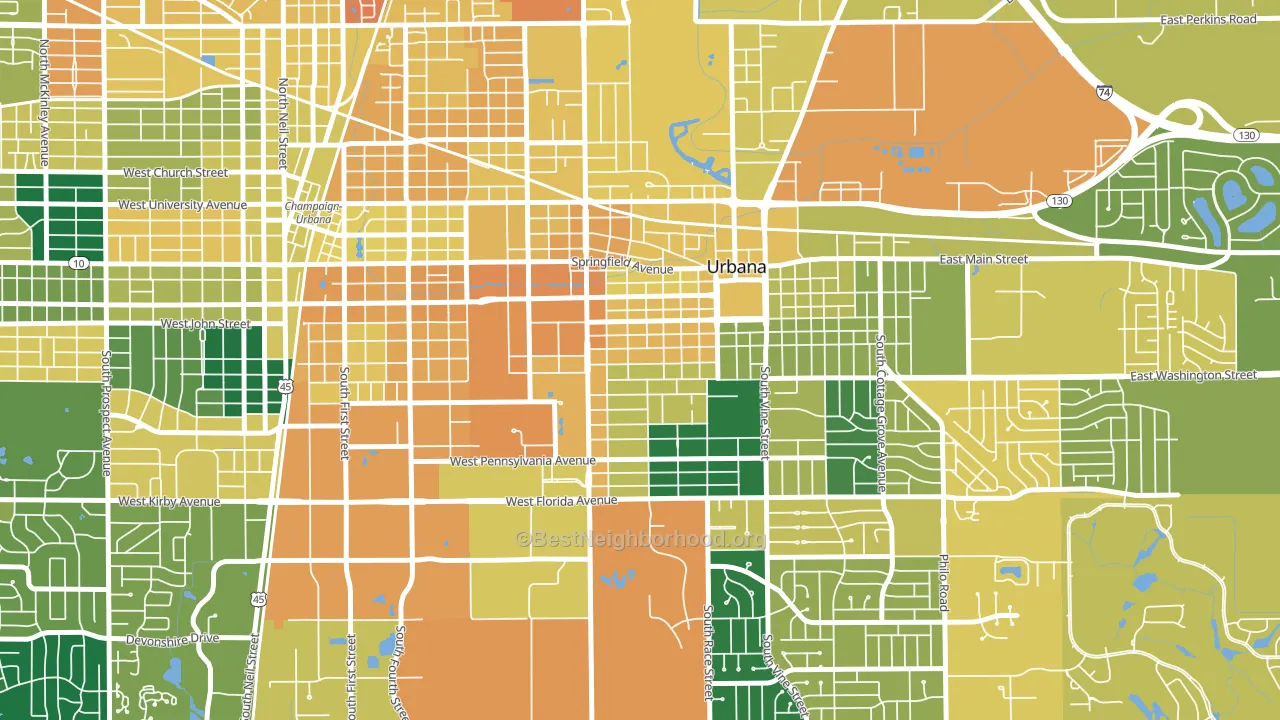
About 52% of adults in West Urbana typically vote, below the U.S. average of about 62%. Among adults in West Urbana, ~44% vote Democratic, ~7% Republican, and ~49% don't vote. The map below shows estimated turnout by block group.
How West Urbana compares
West Urbana runs about 61 points more Democratic than Illinois as a whole.
Politics vary noticeably by block within West Urbana. The southeast side is the most Democratic-leaning (D+83) and the east side is the least Democratic-leaning (D+63), a spread of about 20 points.
Why West Urbana leans the way it does
This analysis examined 14,881 data points per neighborhood to find what predicts political lean and turnout. The items below are a few correlations that stood out for West Urbana, not a ranked or complete list of what matters most.
Areas with high college attainment vote Democratic. About 75% of adults in West Urbana hold a bachelor's degree, about 47 points above the U.S. average of 28%. A high never-married share predicts Democratic voting, and about 73% of adults in West Urbana have never been married, above 98% of neighborhoods.
Cancer-screening access and voter turnout
Places with low colon-cancer-screening access tend to turn out at a lower rate; West Urbana, Urbana, IL sits in the bottom quarter nationally on this measure. Cancer screening does not drive turnout; it reflects income, insurance, and healthcare access.
Why turnout in West Urbana looks the way it does
Renters vote less often than owners. About 72% of households in West Urbana rent, about 47 points above the U.S. average of 25%. Learn more about the findings and methodology on the political spectrum map.
Nearby Neighborhoods
- South Hill, Bloomington, IL D+20
- Downtown Normal, Normal, IL D+48
- Sunnyland, Washington, IL R+22
- Springfield Lake Shore Improvement, Springfield, IL R+6
- Historic West-Side, Springfield, IL D+39
- East Bluff, Peoria, IL D+57
- Center Bluff, Peoria, IL D+47
- Sunset Hills, Peoria, IL D+49
- Indian Hill, Chicago Heights, IL D+53
- Aspen Ridge, Indianapolis, IN D+56
Neighborhoods with Similar Populations
- Leschi, Seattle, WA D+78
- Kendrick, Waco, TX D+2
- Meadowbrook, Augusta, GA D+77
- Gardenside-Colony, Lexington, KY D+21
- Mount Lookout, Cincinnati, OH D+33
- North Image, Vancouver, WA D+6
- Childs Park, St. Petersburg, FL D+68
- Old West Durham, Durham, NC D+73
- Original Thornton, Thornton, CO D+17
- Becton Park, Charlotte, NC D+33
Sources and methodology
Precinct-level voting records used to fit the model come from Illinois State Board of Elections, distributed by the Voting and Election Science Team. Demographic inputs come from the U.S. Census Bureau (ACS 5-year estimates and the 2020 Decennial Census). Health and environmental inputs come from the CDC (PLACES and the Environmental Justice Index). Land cover comes from the USGS and EPA. Election-day and lead-up weather come from PRISM 4km daily grids and the NOAA Global Historical Climatology Network. Mail-voting and election-administration patterns come from the MIT Election Lab's Survey of the Performance of American Elections. Block-group crime detail comes from CrimeGrade. Internet data and modeling support provided by ISPreports.org.
Modeling and analysis by the BestNeighborhood data science team. Full methodology and findings: political spectrum map.
Methodology reviewed by the BestNeighborhood data team. Last updated May 2026.