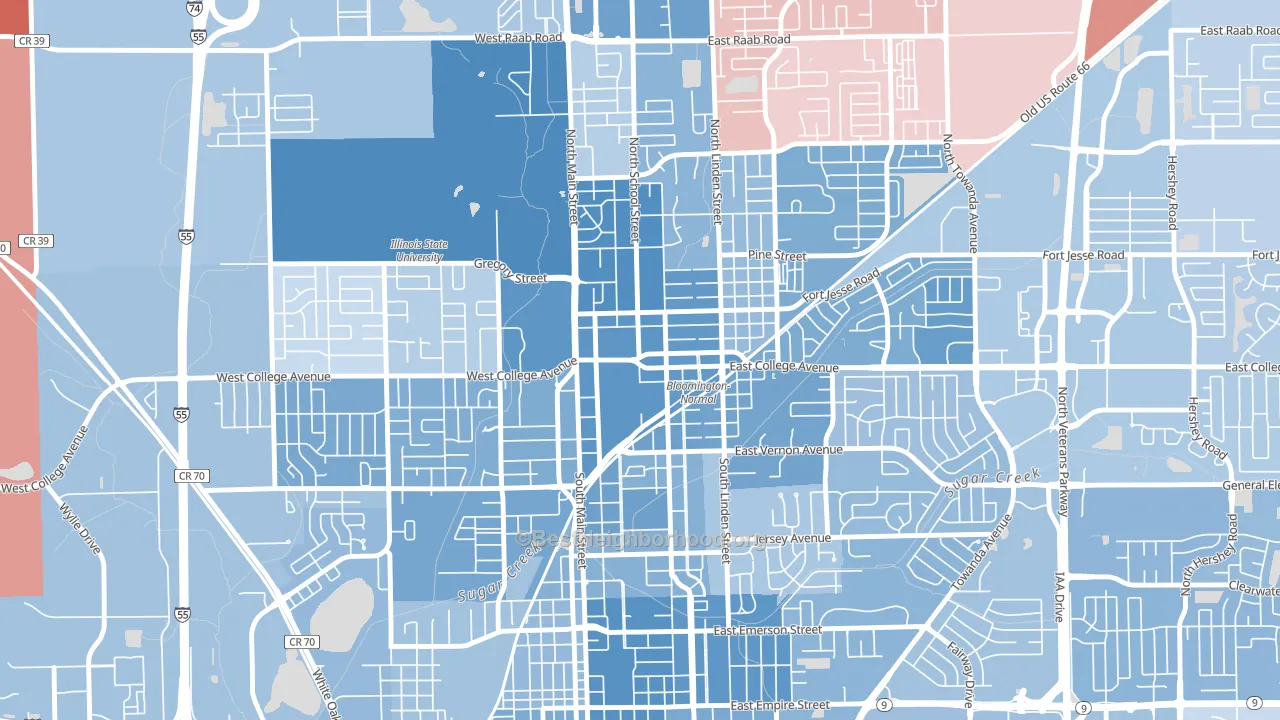
Downtown Normal leans heavily Democratic by roughly 48 points: about 74% of voters vote Democratic and 26% Republican.
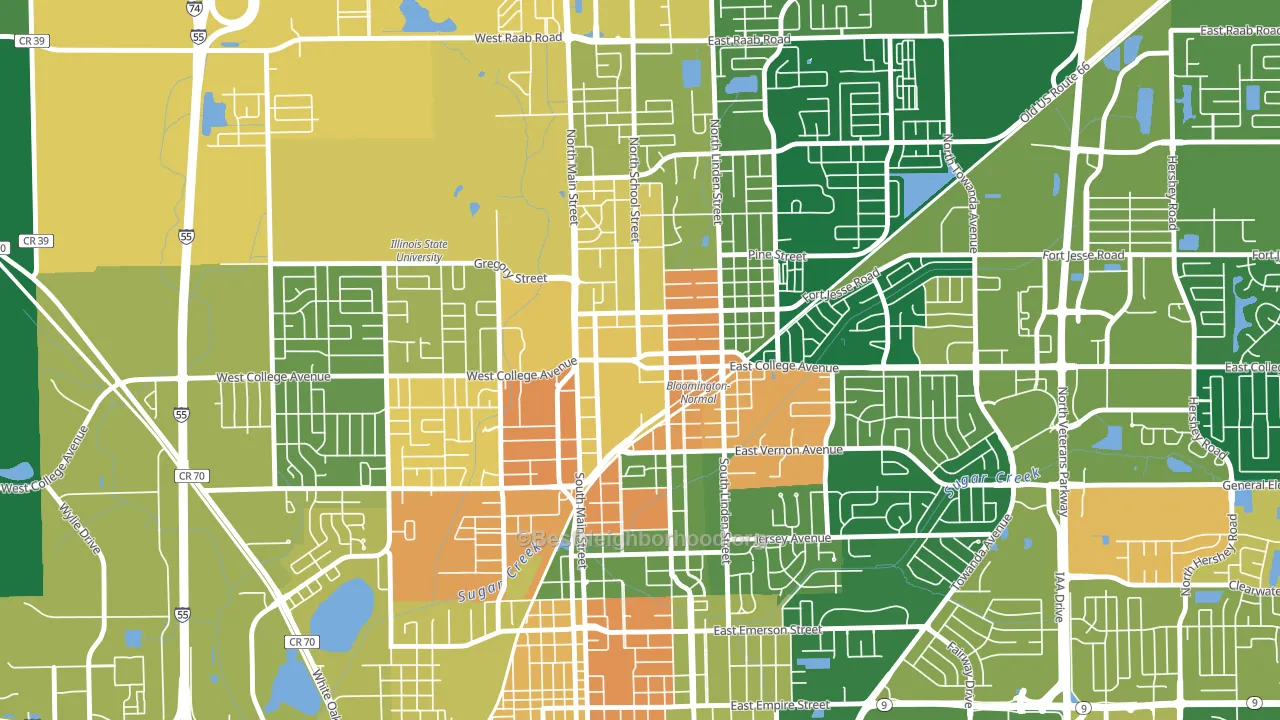
About 41% of adults in Downtown Normal typically vote, below the U.S. average of about 62%. Among adults in Downtown Normal, ~31% vote Democratic, ~11% Republican, and ~58% don't vote. The map below shows estimated turnout by block group.
How Downtown Normal compares
Downtown Normal runs about 37 points more Democratic than Illinois as a whole.
Politics vary noticeably by block within Downtown Normal. The northwest side is the most Democratic-leaning (D+51) and the northeast side is the least Democratic-leaning (D+36), a spread of about 15 points.
Why Downtown Normal leans the way it does
This analysis examined 14,881 data points per neighborhood to find what predicts political lean and turnout. The items below are a few correlations that stood out for Downtown Normal, not a ranked or complete list of what matters most.
Dense areas vote Democratic. More than 99% of residents in Downtown Normal live in densely developed areas, about 64 points above the U.S. average of 36%. A high never-married share predicts Democratic voting, and about 98% of adults in Downtown Normal have never been married, in the top fraction of neighborhoods.
Population density and Democratic lean
Places with high population density tend to lean Democratic; Downtown Normal, Normal, IL sits in the top tenth nationally on this measure.
Why turnout in Downtown Normal looks the way it does
Renters vote less often than owners. About 99% of households in Downtown Normal rent, about 74 points above the U.S. average of 25%. High food insecurity lines up with lower turnout, and about 41% of adults in Downtown Normal report food insecurity, above 94% of neighborhoods. Low high-school completion lines up with lower turnout, and more than 99% of adults in Downtown Normal have completed high school, above 98% of neighborhoods. Learn more about the findings and methodology on the political spectrum map.
Nearby Neighborhoods
- South Hill, Bloomington, IL D+20
- Sunnyland, Washington, IL R+22
- East Bluff, Peoria, IL D+57
- Center Bluff, Peoria, IL D+47
- Sunset Hills, Peoria, IL D+49
- West Urbana, Urbana, IL D+72
- Historic West-Side, Springfield, IL D+39
- Springfield Lake Shore Improvement, Springfield, IL R+6
- Lakewood Springs, Plano, IL Even
- Tall Grass, Naperville, IL D+19
Neighborhoods with Similar Populations
- Arrowhead, San Bernardino, CA D+10
- Lakeland, Baltimore, MD D+56
- Royal Poinciana, Hollywood, FL D+20
- Upper Boggy Creek, Austin, TX D+69
- Agua Fria, El Mirage, AZ D+12
- North Hill Historic District, New Castle, PA R+5
- Mapleton-Fall Creek, Indianapolis, IN D+73
- University Park, Portland, OR D+63
- Plaza-Eastway, Charlotte, NC D+74
- Nashboro Village, Nashville, TN D+39
Sources and methodology
Precinct-level voting records used to fit the model come from Illinois State Board of Elections, distributed by the Voting and Election Science Team. Demographic inputs come from the U.S. Census Bureau (ACS 5-year estimates and the 2020 Decennial Census). Health and environmental inputs come from the CDC (PLACES and the Environmental Justice Index). Land cover comes from the USGS and EPA. Election-day and lead-up weather come from PRISM 4km daily grids and the NOAA Global Historical Climatology Network. Mail-voting and election-administration patterns come from the MIT Election Lab's Survey of the Performance of American Elections. Block-group crime detail comes from CrimeGrade. Internet data and modeling support provided by ISPreports.org.
Modeling and analysis by the BestNeighborhood data science team. Full methodology and findings: political spectrum map.
Methodology reviewed by the BestNeighborhood data team. Last updated May 2026.