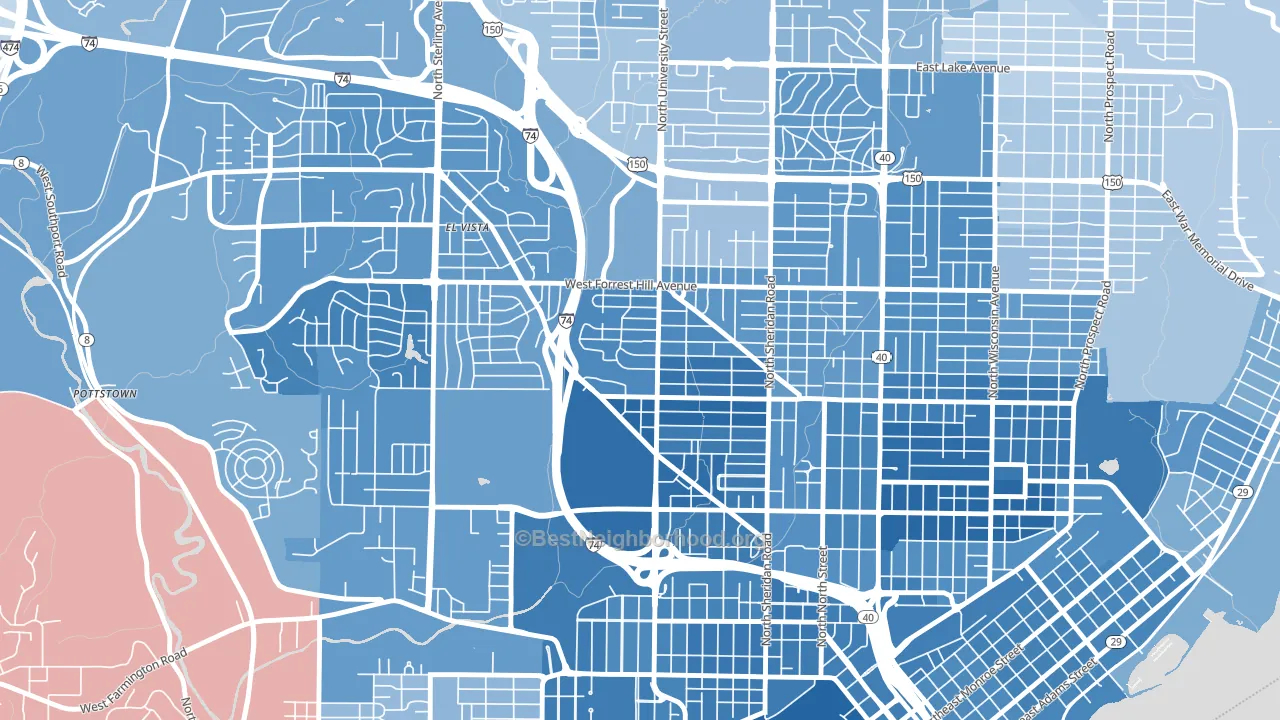
Sunset Hills leans heavily Democratic by roughly 50 points: about 75% of voters vote Democratic and 25% Republican.
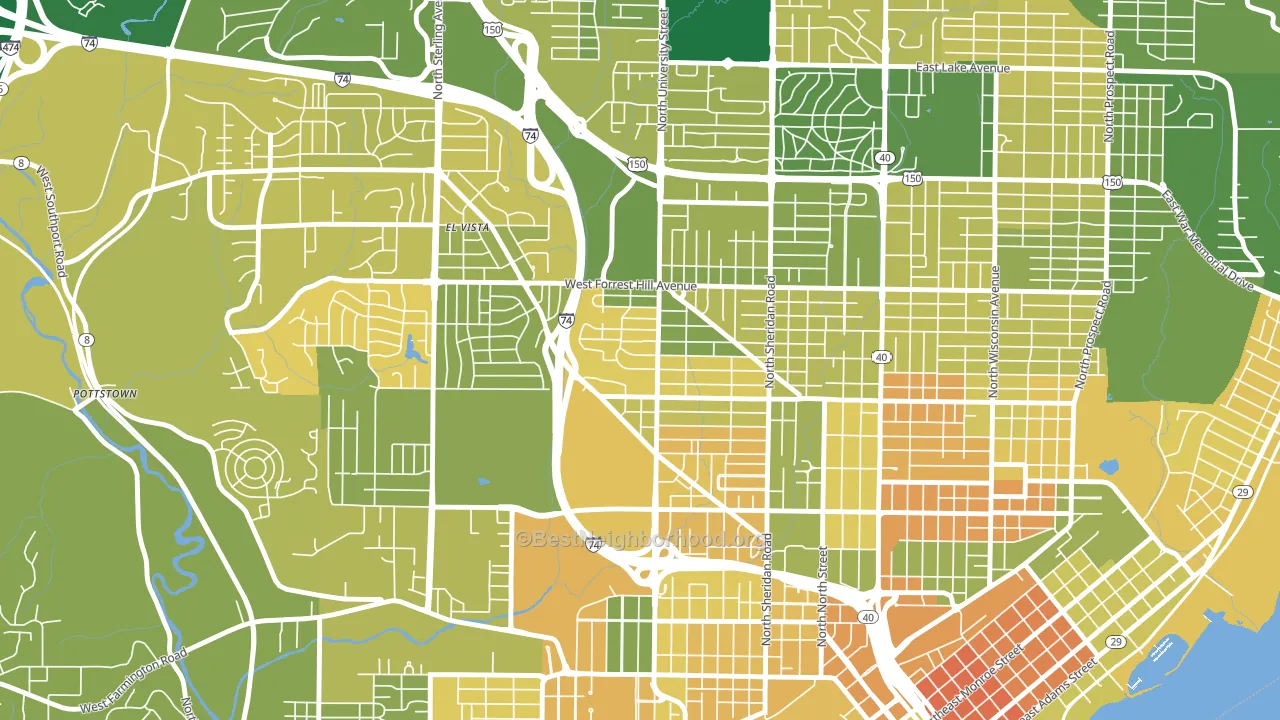
About 55% of adults in Sunset Hills typically vote, below the U.S. average of about 62%. Among adults in Sunset Hills, ~41% vote Democratic, ~14% Republican, and ~45% don't vote. The map below shows estimated turnout by block group.
How Sunset Hills compares
Sunset Hills sits in a sparsely populated area with few comparable neighborhoods nearby.
Sunset Hills runs about 39 points more Democratic than Illinois as a whole.
Politics vary noticeably by block within Sunset Hills. The southwest side is the most Democratic-leaning (D+64) and the northeast side is the least Democratic-leaning (D+28), a spread of about 36 points.
Why Sunset Hills leans the way it does
This analysis examined 14,881 data points per neighborhood to find what predicts political lean and turnout. The items below are a few correlations that stood out for Sunset Hills, not a ranked or complete list of what matters most.
Areas with many never-married adults vote Democratic. About 48% of adults in Sunset Hills have never been married, modestly above similar-sized neighborhoods (around 37%).
Preventive-care access and voter turnout
Places with limited routine preventive-care access tend to turn out at a lower rate; Sunset Hills, Peoria, IL sits in the bottom quarter nationally on this measure. Dental visits do not drive turnout; the rate reflects income, insurance, and healthcare access, which line up with who votes.
Why turnout in Sunset Hills looks the way it does
Turnout in Sunset Hills sits close to the national pattern. Routine healthcare access, homeownership, education, and food security all land near their national averages here. Learn more about the findings and methodology on the political spectrum map.
Nearby Neighborhoods
- Center Bluff, Peoria, IL D+47
- East Bluff, Peoria, IL D+57
- Sunnyland, Washington, IL R+22
- Downtown Normal, Normal, IL D+48
- South Hill, Bloomington, IL D+20
- Historic West-Side, Springfield, IL D+39
- Springfield Lake Shore Improvement, Springfield, IL R+6
- Park Hill, Moline, IL D+18
- West Urbana, Urbana, IL D+72
- Lakewood Springs, Plano, IL Even
Neighborhoods with Similar Populations
- Squak Mountain, Issaquah, WA D+43
- South Beach Miami Beach, Miami Beach, FL R+5
- West Laurel, Laurel, MD D+41
- The Woodlands, Randallstown, MD D+83
- Garden Home-Raleigh Hills, Portland, OR D+55
- Bayshore, Miami Beach, FL R+4
- Reichlieu, Mobile, AL D+21
- Donaldson Terrace, San Antonio, TX D+31
- Centennial, Burlington, VT D+68
- Italian Village, Coral Gables, FL D+3
Sources and methodology
Precinct-level voting records used to fit the model come from Illinois State Board of Elections, distributed by the Voting and Election Science Team. Demographic inputs come from the U.S. Census Bureau (ACS 5-year estimates and the 2020 Decennial Census). Health and environmental inputs come from the CDC (PLACES and the Environmental Justice Index). Land cover comes from the USGS and EPA. Election-day and lead-up weather come from PRISM 4km daily grids and the NOAA Global Historical Climatology Network. Mail-voting and election-administration patterns come from the MIT Election Lab's Survey of the Performance of American Elections. Block-group crime detail comes from CrimeGrade. Internet data and modeling support provided by ISPreports.org.
Modeling and analysis by the BestNeighborhood data science team. Full methodology and findings: political spectrum map.
Methodology reviewed by the BestNeighborhood data team. Last updated May 2026.