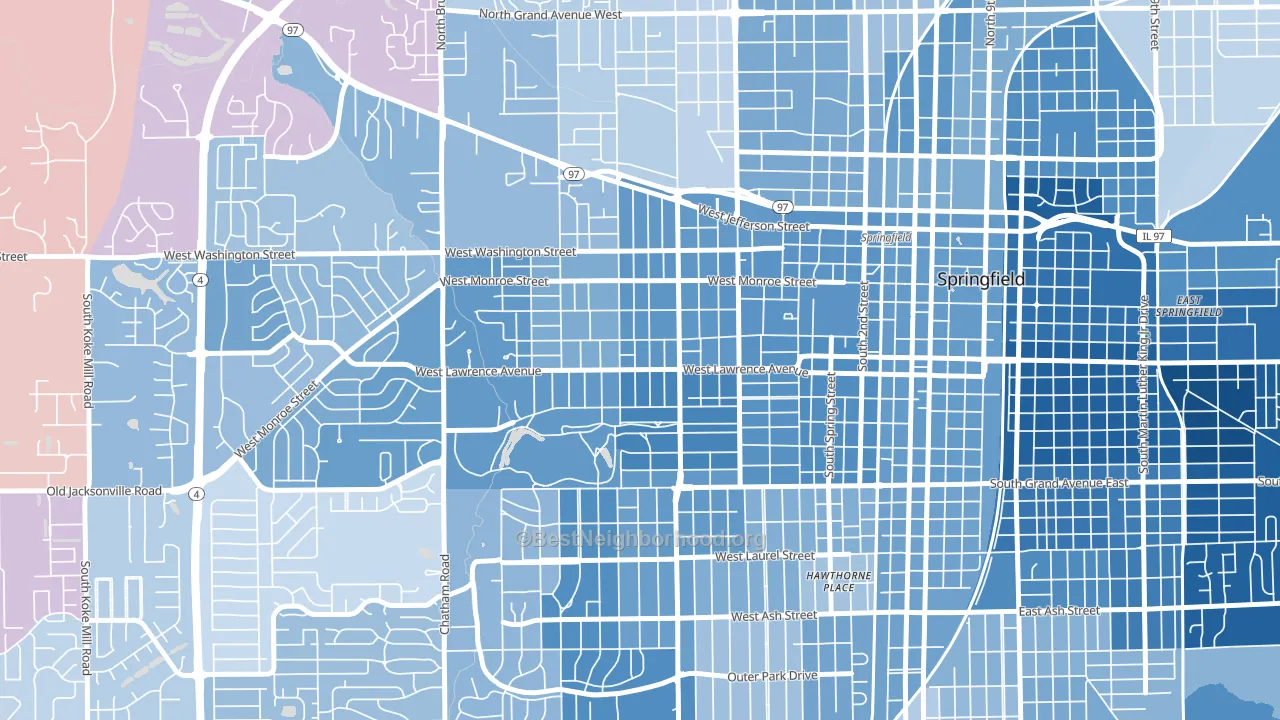
Historic West-Side leans heavily Democratic by roughly 38 points: about 69% of voters vote Democratic and 31% Republican.
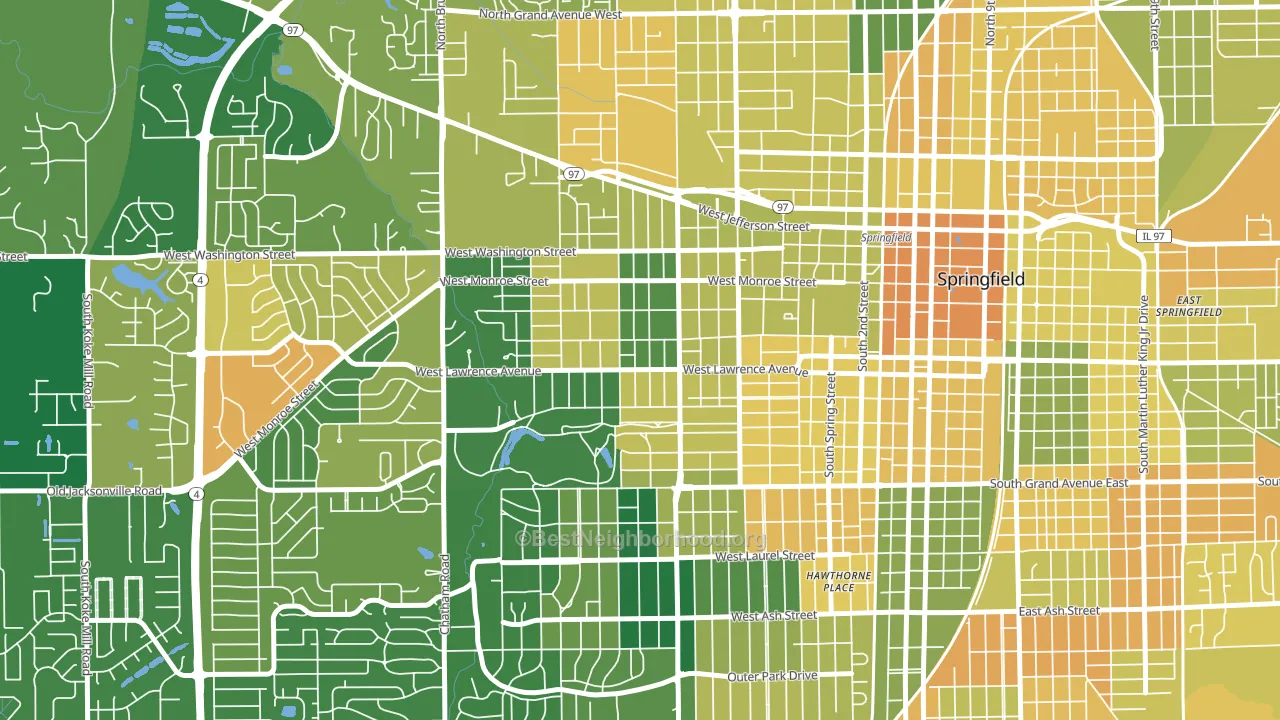
About 70% of adults in Historic West-Side typically vote, above the U.S. average of about 62%. Among adults in Historic West-Side, ~48% vote Democratic, ~22% Republican, and ~30% don't vote. The map below shows estimated turnout by block group.
How Historic West-Side compares
Historic West-Side runs about 28 points more Democratic than Illinois as a whole.
Politics vary noticeably by block within Historic West-Side. The east side is the most Democratic-leaning (D+44) and the northwest side is the least Democratic-leaning (D+32), a spread of about 12 points.
Why Historic West-Side leans the way it does
Density, race composition, education, and family structure all sit close to their national averages in Historic West-Side. The lean here lands roughly where demographic data alone would predict.
Walkability and Democratic lean
Places with a highly walkable street grid tend to lean Democratic; Historic West-Side, Springfield, IL sits above the national average on this measure. A walkable street grid does not change how people vote; it mostly reflects how urban a place is.
Why turnout in Historic West-Side looks the way it does
Turnout in Historic West-Side sits close to the national pattern. Learn more about the findings and methodology on the political spectrum map.
Nearby Neighborhoods
- Springfield Lake Shore Improvement, Springfield, IL R+6
- South Hill, Bloomington, IL D+20
- Downtown Normal, Normal, IL D+48
- Sunnyland, Washington, IL R+22
- East Bluff, Peoria, IL D+57
- Sunset Hills, Peoria, IL D+49
- Center Bluff, Peoria, IL D+47
- Old Town Florissant, Florissant, MO D+30
- West Urbana, Urbana, IL D+72
- Baden, St. Louis, MO D+83
Neighborhoods with Similar Populations
- Downtown Carlsbad, Carlsbad, CA D+24
- Wendover-Sedgewood, Charlotte, NC D+16
- Manhattan Beach, Brooklyn, NY R+51
- Lake Forest, Lake Oswego, OR D+42
- Beechwood, Parkersburg, WV R+25
- Newmarket South, Newport News, VA D+59
- Carver-Richmond, Richmond, VA D+70
- Crossley Crossing, Round Rock, TX Even
- Harper's Landing, Conroe, TX R+28
- East Boulder, Boulder, CO D+61
Sources and methodology
Precinct-level voting records used to fit the model come from Illinois State Board of Elections, distributed by the Voting and Election Science Team. Demographic inputs come from the U.S. Census Bureau (ACS 5-year estimates and the 2020 Decennial Census). Health and environmental inputs come from the CDC (PLACES and the Environmental Justice Index). Land cover comes from the USGS and EPA. Election-day and lead-up weather come from PRISM 4km daily grids and the NOAA Global Historical Climatology Network. Mail-voting and election-administration patterns come from the MIT Election Lab's Survey of the Performance of American Elections. Block-group crime detail comes from CrimeGrade. Internet data and modeling support provided by ISPreports.org.
Modeling and analysis by the BestNeighborhood data science team. Full methodology and findings: political spectrum map.
Methodology reviewed by the BestNeighborhood data team. Last updated May 2026.