Westchester leans heavily Democratic by roughly 34 points: about 67% of voters vote Democratic and 33% Republican.
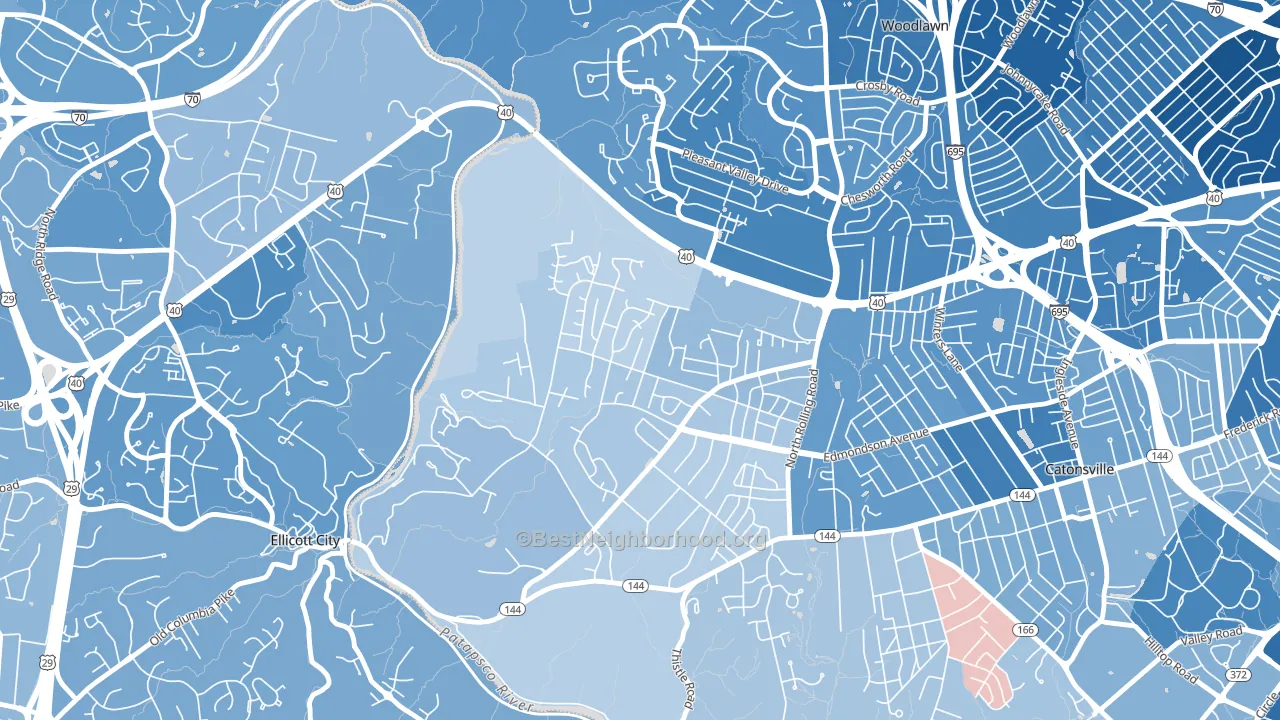
About 86% of adults in Westchester typically vote, above the U.S. average of about 62%. Among adults in Westchester, ~58% vote Democratic, ~28% Republican, and ~14% don't vote. The map below shows estimated turnout by block group.
How Westchester compares
Among neighborhoods within 5 miles, Westchester leans more Democratic than 1 of 11 neighbors.
Westchester runs about 6 points more Democratic than Maryland as a whole.
Why Westchester leans the way it does
This analysis examined 14,881 data points per neighborhood to find what predicts political lean and turnout. The items below are a few correlations that stood out for Westchester, not a ranked or complete list of what matters most.
Areas with high college attainment vote Democratic. About 62% of adults in Westchester hold a bachelor's degree, about 33 points above the U.S. average of 28%.
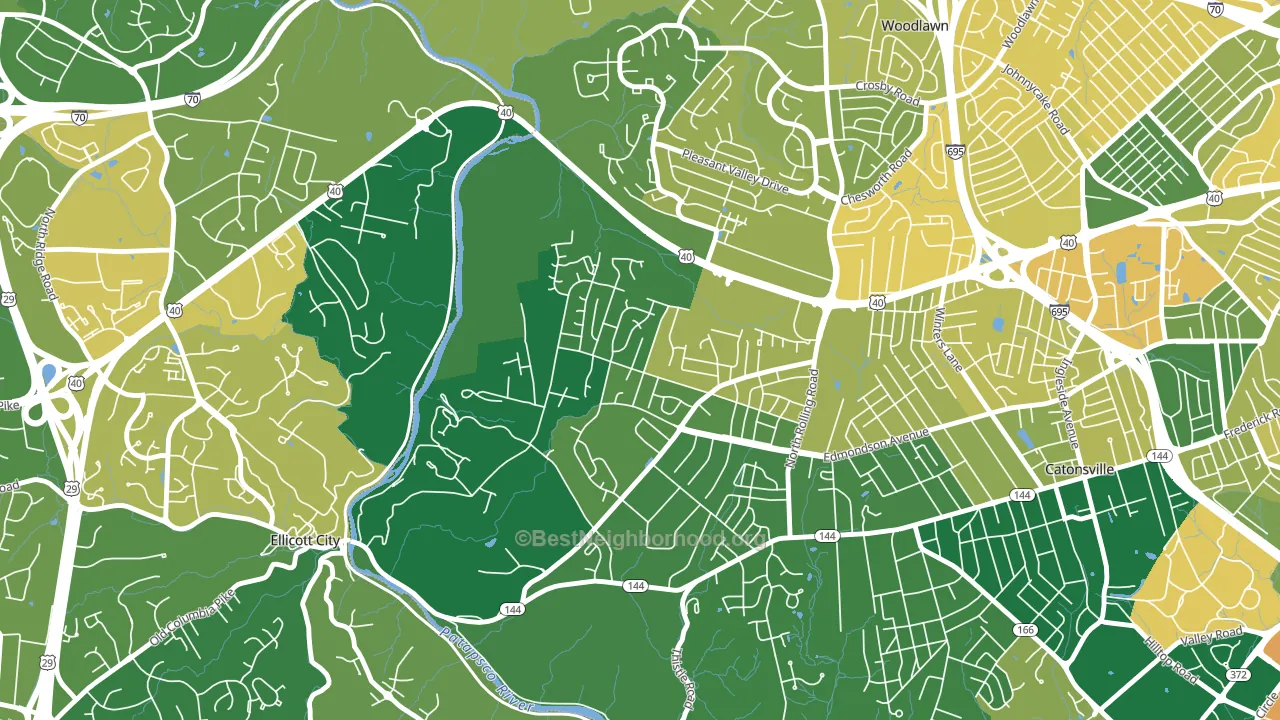
Homeownership and voter turnout
Places with homeowner-heavy households tend to turn out at a higher rate; Westchester, Catonsville, MD sits in the top quarter nationally on this measure.
Why turnout in Westchester looks the way it does
Homeowners vote more often than renters. About 85% of households in Westchester own their home, about 8 points above the Maryland average of 77%. Learn more about the findings and methodology on the political spectrum map.
Nearby Neighborhoods
- Catonsville Heights, Catonsville, MD D+45
- Westview Park, Woodlawn, MD D+57
- Chadwick Manor, Woodlawn, MD D+59
- Westowne, Catonsville, MD D+50
- Edmondson Heights, Woodlawn, MD D+81
- St Denis, Catonsville, MD D+18
- Westgate, Baltimore, MD D+77
- Hunting Ridge, Baltimore, MD D+86
- Woodmoor, Lochearn, MD D+86
- Beechfielf-Irvington Area, Baltimore, MD D+83
Neighborhoods with Similar Populations
- Putnam Lake, Patterson, NY R+19
- Vista del Norte, San Antonio, TX D+4
- Ravine Gardens, Matawan, NJ R+4
- Port Dixie, Lake Lorraine, FL R+23
- Benton Park, St. Louis, MO D+74
- Downtown Rialto, Rialto, CA D+28
- South Broadway, Albuquerque, NM D+48
- Terrace-Shurtleff, Napa, CA D+36
- Garfield, Pittsburgh, PA D+84
- Central Eastside, Erie, PA D+44
Sources and methodology
Precinct-level voting records used to fit the model come from Maryland State Board of Elections, distributed by the Voting and Election Science Team. Demographic inputs come from the U.S. Census Bureau (ACS 5-year estimates and the 2020 Decennial Census). Health and environmental inputs come from the CDC (PLACES and the Environmental Justice Index). Land cover comes from the USGS and EPA. Election-day and lead-up weather come from PRISM 4km daily grids and the NOAA Global Historical Climatology Network. Mail-voting and election-administration patterns come from the MIT Election Lab's Survey of the Performance of American Elections. Block-group crime detail comes from CrimeGrade. Internet data and modeling support provided by ISPreports.org.
Modeling and analysis by the BestNeighborhood data science team. Full methodology and findings: political spectrum map.
Methodology reviewed by the BestNeighborhood data team. Last updated May 2026.