Westgate is a Democratic stronghold. About 89% of voters here vote Democratic and 11% Republican.
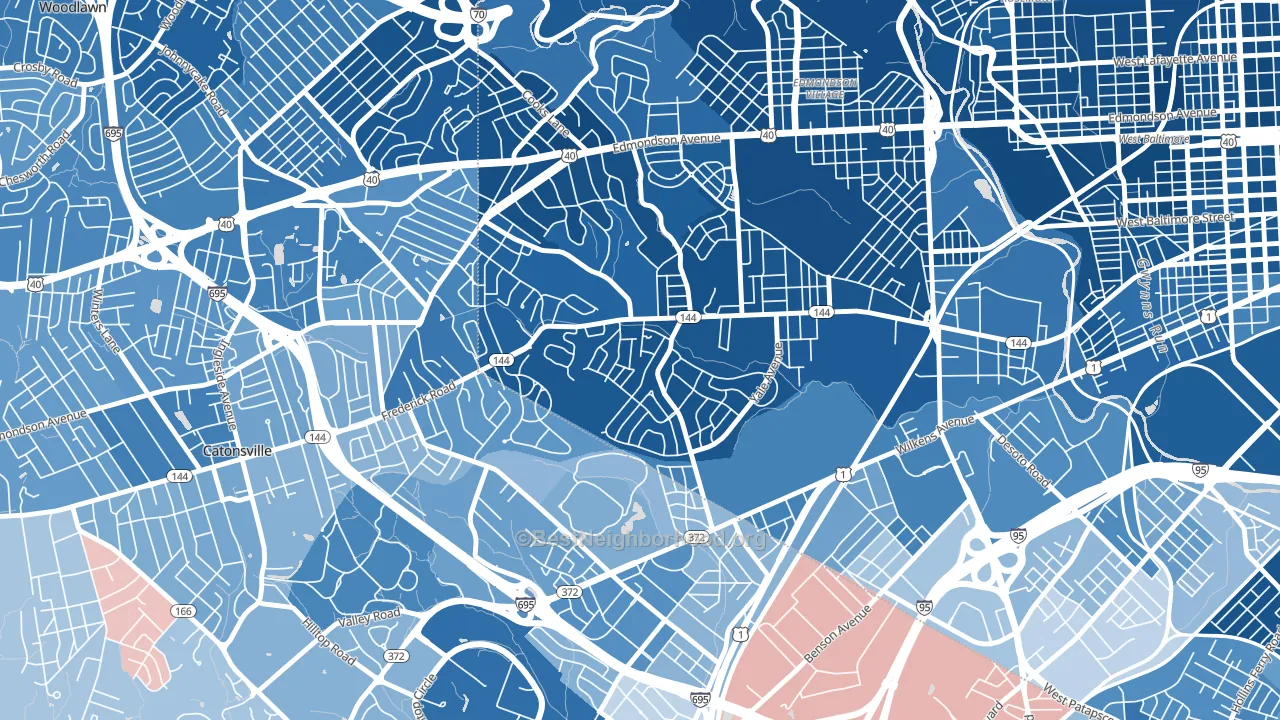
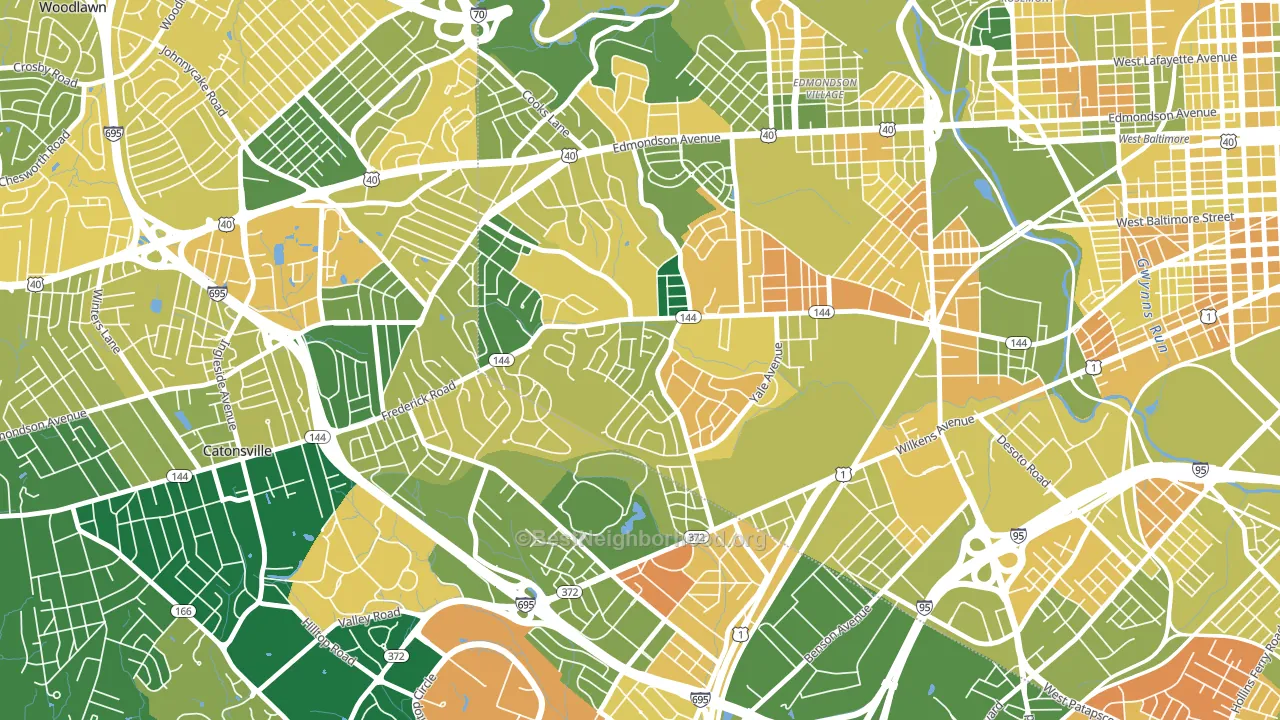
About 65% of adults in Westgate typically vote, near the U.S. average of about 62%. Among adults in Westgate, ~58% vote Democratic, ~7% Republican, and ~35% don't vote. The map below shows estimated turnout by block group.
How Westgate compares
Among neighborhoods within 5 miles, Westgate leans more Democratic than 14 of 30 neighbors.
Westgate runs about 48 points more Democratic than Maryland as a whole.
Politics vary noticeably by block within Westgate. The east side is the most Democratic-leaning (D+83) and the southeast side is the least Democratic-leaning (D+56), a spread of about 27 points.
Why Westgate leans the way it does
This analysis examined 14,881 data points per neighborhood to find what predicts political lean and turnout. The items below are a few correlations that stood out for Westgate, not a ranked or complete list of what matters most.
Areas with many never-married adults vote Democratic. About 53% of adults in Westgate have never been married, modestly above similar-sized neighborhoods (around 44%).
Walkability and Democratic lean
Places with a highly walkable street grid tend to lean Democratic; Westgate, Baltimore, MD sits above the national average on this measure. A walkable street grid does not change how people vote; it mostly reflects how urban a place is.
Why turnout in Westgate looks the way it does
Areas with strong routine healthcare access turn out at higher rates. Westgate is in the top quarter nationally for routine-care measures such as insurance coverage, preventive screenings, and dental visits. The dental-visit rate here is about 54%, about 6 points below the U.S. average of 60%. Learn more about the findings and methodology on the political spectrum map.
Nearby Neighborhoods
- Beechfielf-Irvington Area, Baltimore, MD D+83
- Westowne, Catonsville, MD D+50
- Hunting Ridge, Baltimore, MD D+86
- Edmondson Heights, Woodlawn, MD D+81
- Morrell Park, Baltimore, MD D+22
- Greater Rosemont, Baltimore, MD D+72
- Catonsville Heights, Catonsville, MD D+45
- Westview Park, Woodlawn, MD D+57
- Winsor Hills, Baltimore, MD D+87
- Forest Park, Baltimore, MD D+86
Neighborhoods with Similar Populations
- Norteast Citizens Action, Grand Rapids, MI D+34
- Wholesale District-Skid Row, Los Angeles, CA D+53
- East Price Hill, Cincinnati, OH D+36
- Larkspur, Bend, OR D+16
- Sun City Summerlin, Las Vegas, NV D+8
- West Adams, Los Angeles, CA D+61
- Woodlawn, Portland, OR D+78
- Silver Spring, Milwaukee, WI D+74
- Caddo Heights-South Highlands, Shreveport, LA D+31
- Idle Hour, Lexington, KY D+35
Sources and methodology
Precinct-level voting records used to fit the model come from Maryland State Board of Elections, distributed by the Voting and Election Science Team. Demographic inputs come from the U.S. Census Bureau (ACS 5-year estimates and the 2020 Decennial Census). Health and environmental inputs come from the CDC (PLACES and the Environmental Justice Index). Land cover comes from the USGS and EPA. Election-day and lead-up weather come from PRISM 4km daily grids and the NOAA Global Historical Climatology Network. Mail-voting and election-administration patterns come from the MIT Election Lab's Survey of the Performance of American Elections. Block-group crime detail comes from CrimeGrade. Internet data and modeling support provided by ISPreports.org.
Modeling and analysis by the BestNeighborhood data science team. Full methodology and findings: political spectrum map.
Methodology reviewed by the BestNeighborhood data team. Last updated May 2026.