Chadwick Manor is a Democratic stronghold. About 80% of voters here vote Democratic and 20% Republican.
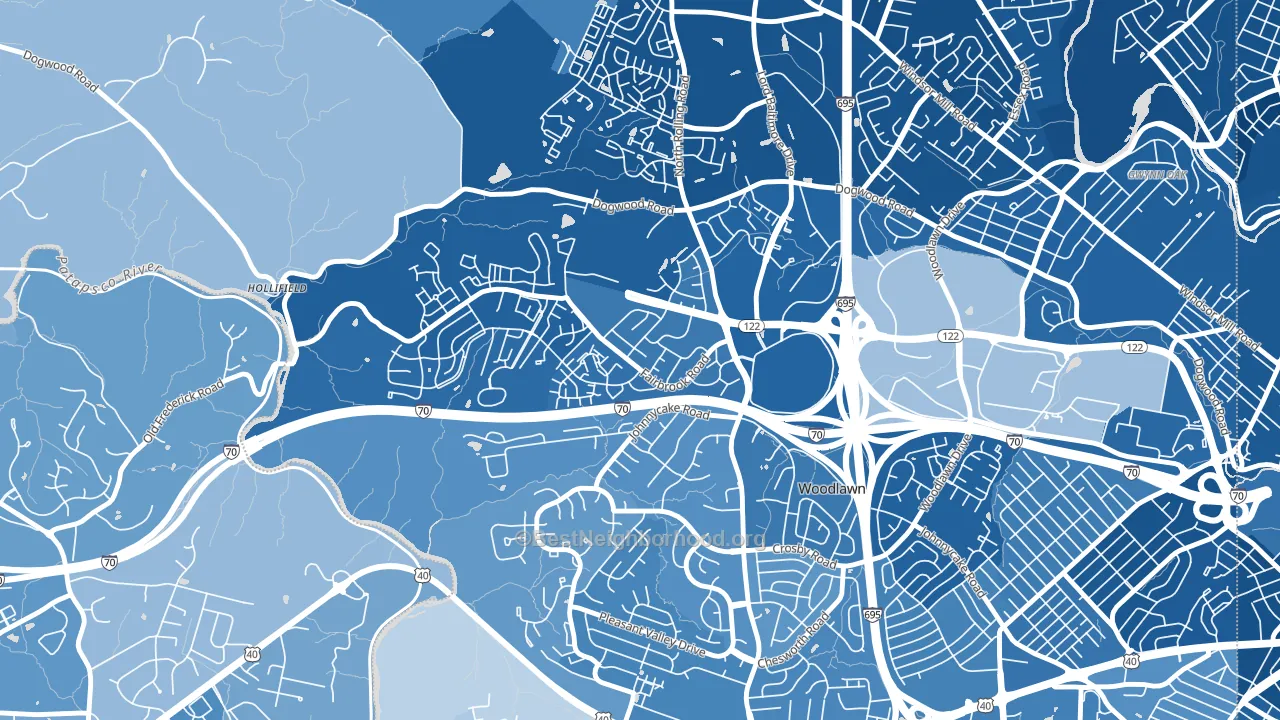
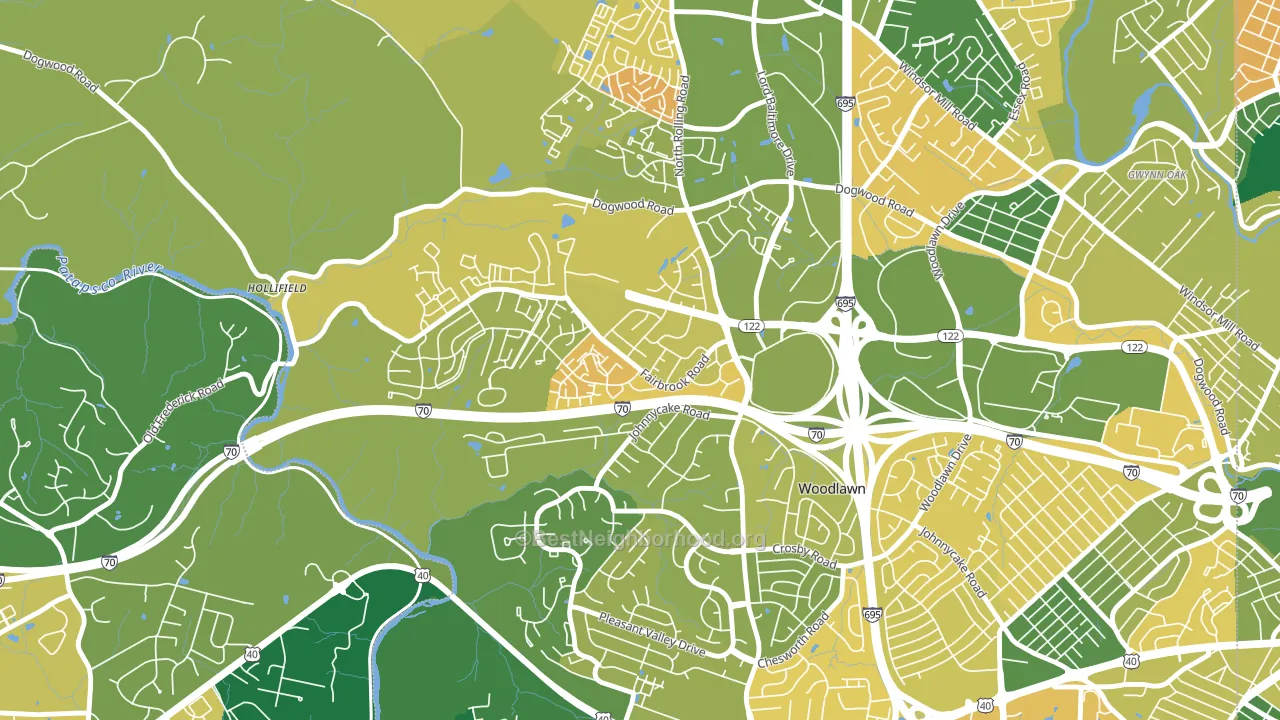
About 49% of adults in Chadwick Manor typically vote, below the U.S. average of about 62%. Among adults in Chadwick Manor, ~39% vote Democratic, ~10% Republican, and ~51% don't vote. The map below shows estimated turnout by block group.
How Chadwick Manor compares
Among neighborhoods within 5 miles, Chadwick Manor leans more Democratic than 5 of 14 neighbors.
Chadwick Manor runs about 31 points more Democratic than Maryland as a whole.
Politics vary noticeably by block within Chadwick Manor. The southwest side is the most Democratic-leaning (D+63) and the south side is the least Democratic-leaning (D+42), a spread of about 22 points.
Why Chadwick Manor leans the way it does
This analysis examined 14,881 data points per neighborhood to find what predicts political lean and turnout. The items below are a few correlations that stood out for Chadwick Manor, not a ranked or complete list of what matters most.
Areas with many never-married adults vote Democratic. About 57% of adults in Chadwick Manor have never been married, well above similar-sized neighborhoods (around 40%).
Population density and Democratic lean
Places with high population density tend to lean Democratic; Chadwick Manor, Woodlawn, MD sits in the top tenth nationally on this measure.
Why turnout in Chadwick Manor looks the way it does
Crowded housing lines up with lower turnout. About 15% of homes in Chadwick Manor have more than one occupant per room, above 96% of neighborhoods. Renters vote less often than owners, and about 72% of households in Chadwick Manor rent, compared to around 33% in nearby neighborhoods. Learn more about the findings and methodology on the political spectrum map.
Nearby Neighborhoods
- Westview Park, Woodlawn, MD D+57
- Westchester, Catonsville, MD D+34
- Catonsville Heights, Catonsville, MD D+45
- Woodmoor, Lochearn, MD D+86
- Edmondson Heights, Woodlawn, MD D+81
- Westowne, Catonsville, MD D+50
- Howard Park, Gwynn Oak, MD D+85
- Hunting Ridge, Baltimore, MD D+86
- Westgate, Baltimore, MD D+77
- Forest Park, Baltimore, MD D+86
Neighborhoods with Similar Populations
- Greek Track, Simi Valley, CA Even
- Washington Park, Milwaukee, WI D+68
- Mays Chapel Village, Mays Chapel, MD D+13
- Presidential Park, Riverside, CA D+5
- John Ball Park, Grand Rapids, MI D+31
- Washington Park, Hollywood, FL D+62
- Grasslyn Manor, Milwaukee, WI D+80
- Arborwood, Fort Myers, FL R+23
- Fairlane, Kansas City, MO D+58
- Northwest Everett, Everett, WA D+39
Sources and methodology
Precinct-level voting records used to fit the model come from Maryland State Board of Elections, distributed by the Voting and Election Science Team. Demographic inputs come from the U.S. Census Bureau (ACS 5-year estimates and the 2020 Decennial Census). Health and environmental inputs come from the CDC (PLACES and the Environmental Justice Index). Land cover comes from the USGS and EPA. Election-day and lead-up weather come from PRISM 4km daily grids and the NOAA Global Historical Climatology Network. Mail-voting and election-administration patterns come from the MIT Election Lab's Survey of the Performance of American Elections. Block-group crime detail comes from CrimeGrade. Internet data and modeling support provided by ISPreports.org.
Modeling and analysis by the BestNeighborhood data science team. Full methodology and findings: political spectrum map.
Methodology reviewed by the BestNeighborhood data team. Last updated May 2026.