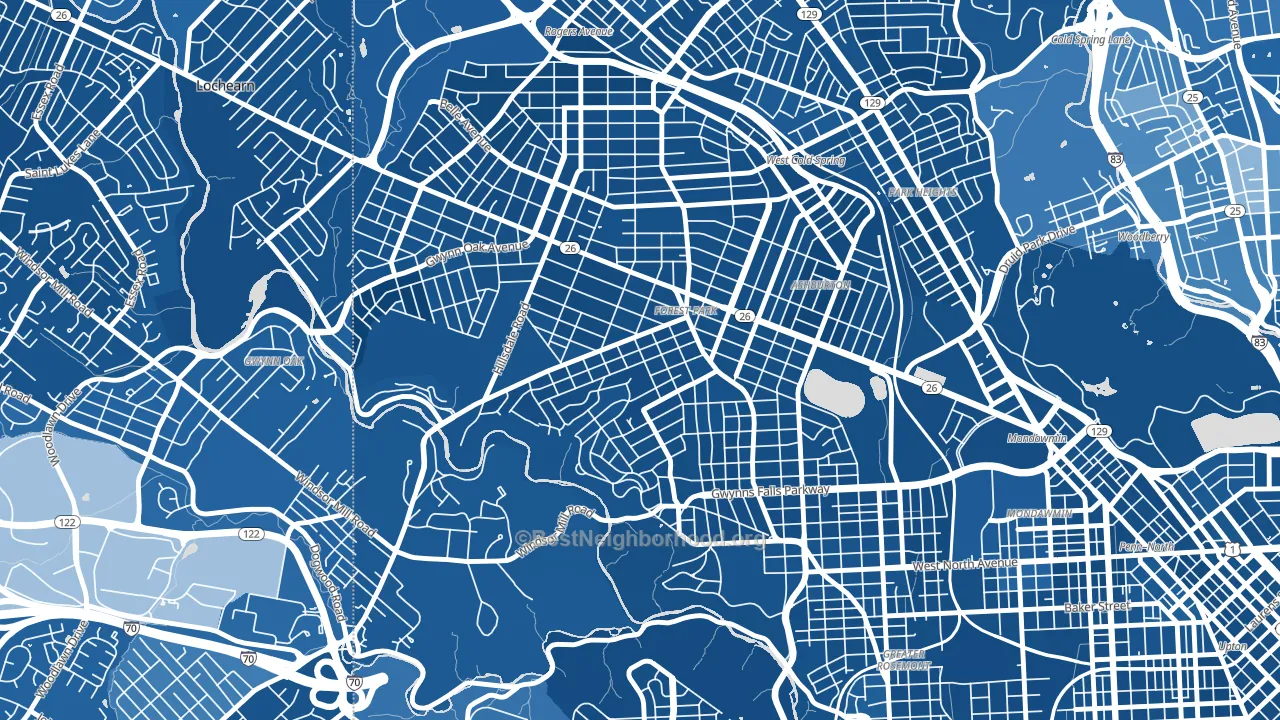
Forest Park is a Democratic stronghold. About 93% of voters here vote Democratic and 7% Republican.
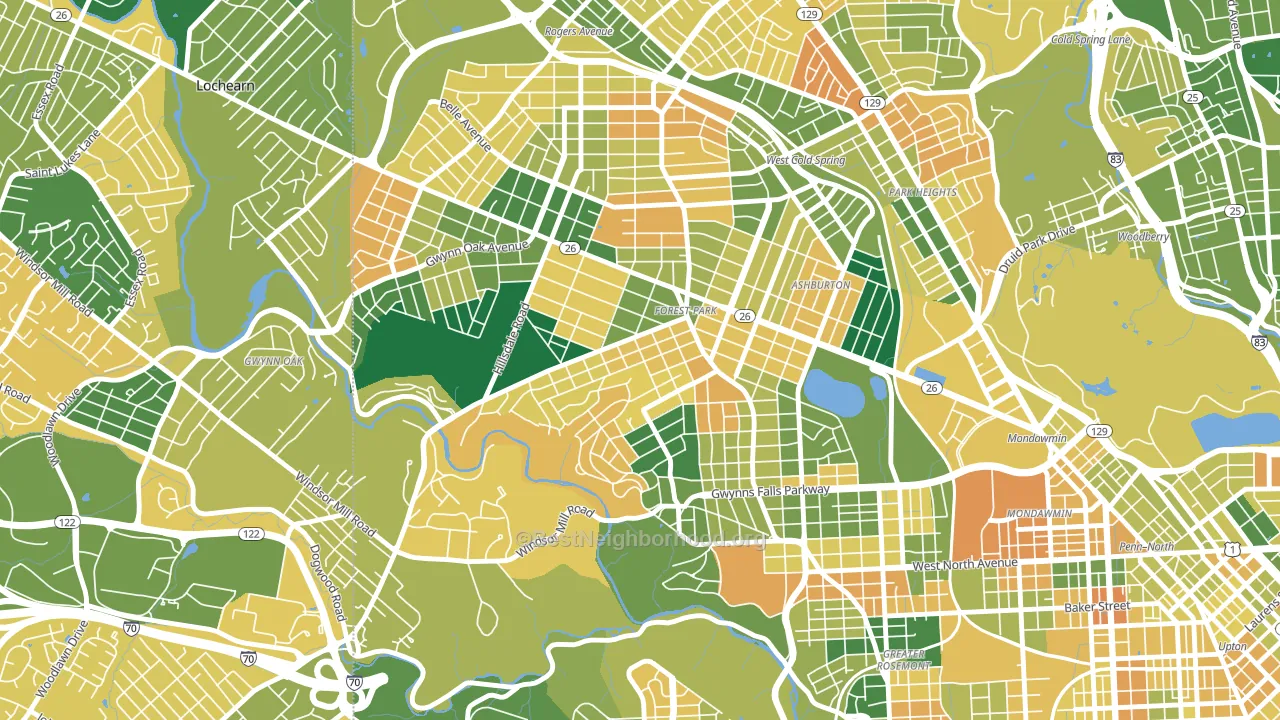
About 54% of adults in Forest Park typically vote, below the U.S. average of about 62%. Among adults in Forest Park, ~51% vote Democratic, ~4% Republican, and ~45% don't vote. The map below shows estimated turnout by block group.
How Forest Park compares
Among neighborhoods within 5 miles, Forest Park leans more Democratic than 33 of 37 neighbors.
Forest Park runs about 58 points more Democratic than Maryland as a whole.
Why Forest Park leans the way it does
This analysis examined 14,881 data points per neighborhood to find what predicts political lean and turnout. The items below are a few correlations that stood out for Forest Park, not a ranked or complete list of what matters most.
Areas with many never-married adults vote Democratic. About 48% of adults in Forest Park have never been married, about 19 points above the U.S. average of 29%.
Population density and Democratic lean
Places with high population density tend to lean Democratic; Forest Park, Baltimore, MD sits in the top tenth nationally on this measure.
Why turnout in Forest Park looks the way it does
Areas with limited routine healthcare access turn out at lower rates. Forest Park is in the bottom quarter nationally for routine-care measures such as insurance coverage, preventive screenings, and dental visits. The dental-visit rate here is about 50%, about 14 points below the Maryland average of 64%. High food insecurity lines up with lower turnout, and about 32% of adults in Forest Park report food insecurity, above 85% of neighborhoods. High-crime urban areas turn out at lower rates, and Forest Park sits in the top 15% on a violent-crime measure. Learn more about the findings and methodology on the political spectrum map.
Nearby Neighborhoods
- Winsor Hills, Baltimore, MD D+87
- Howard Park, Gwynn Oak, MD D+85
- Park Heights, Baltimore, MD D+86
- Mondawin-Walbrook, Baltimore, MD D+86
- Pimlico, Baltimore, MD D+85
- Hunting Ridge, Baltimore, MD D+86
- Edmondson Heights, Woodlawn, MD D+81
- Glen-Fallstaff, Baltimore, MD D+49
- Hampden-Woodberry-Remington, Baltimore, MD D+52
- Beechfielf-Irvington Area, Baltimore, MD D+83
Neighborhoods with Similar Populations
- Central Business District, Cincinnati, OH D+52
- Michigan-Martin, Detroit, MI D+36
- Fairwood Greens, Fairwood, WA D+31
- Glenham-Belhar, Baltimore, MD D+74
- Old City-Produce and Waterfront, Oakland, CA D+60
- Bivins Addition, Amarillo, TX R+18
- Schoolcraft Southfield, Detroit, MI D+88
- Coral Ridge Country Club Estates, Fort Lauderdale, FL R+12
- West Village, Oxnard, CA D+29
- Waller, Tacoma, WA R+4
Sources and methodology
Precinct-level voting records used to fit the model come from Maryland State Board of Elections, distributed by the Voting and Election Science Team. Demographic inputs come from the U.S. Census Bureau (ACS 5-year estimates and the 2020 Decennial Census). Health and environmental inputs come from the CDC (PLACES and the Environmental Justice Index). Land cover comes from the USGS and EPA. Election-day and lead-up weather come from PRISM 4km daily grids and the NOAA Global Historical Climatology Network. Mail-voting and election-administration patterns come from the MIT Election Lab's Survey of the Performance of American Elections. Block-group crime detail comes from CrimeGrade. Internet data and modeling support provided by ISPreports.org.
Modeling and analysis by the BestNeighborhood data science team. Full methodology and findings: political spectrum map.
Methodology reviewed by the BestNeighborhood data team. Last updated May 2026.