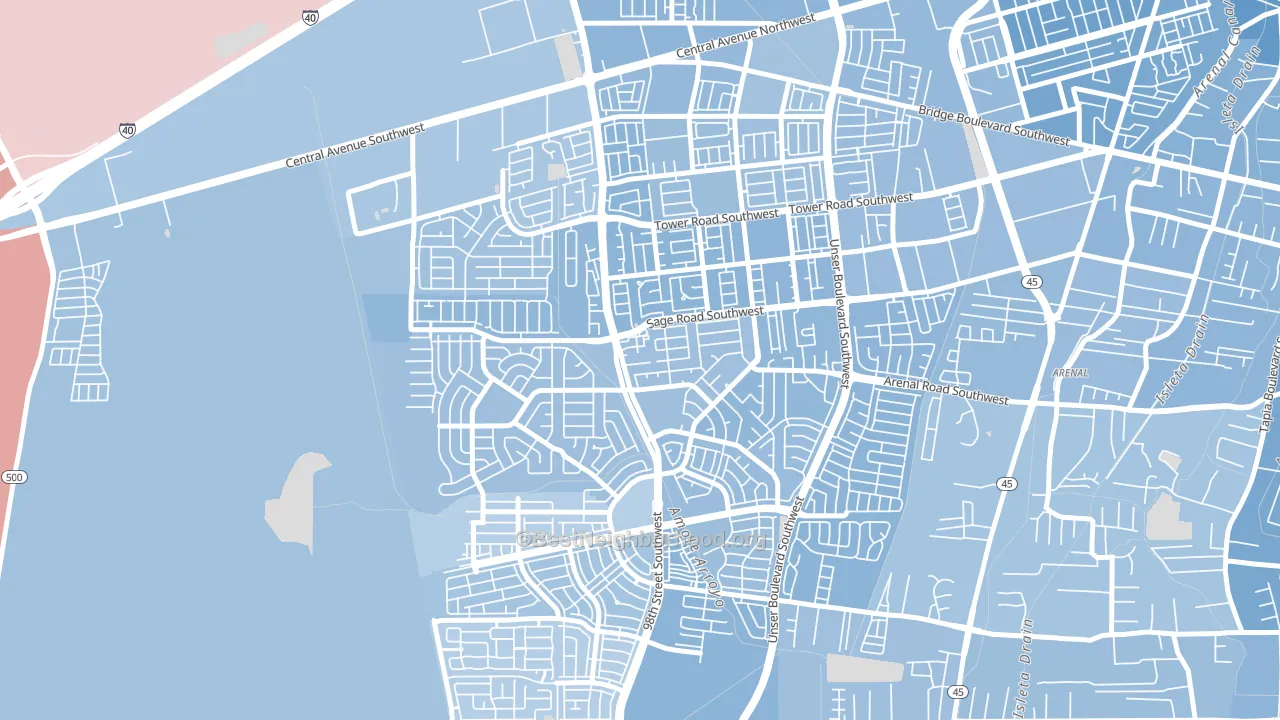
Westgate Hts leans Democratic by roughly 16 points: about 58% of voters vote Democratic and 42% Republican.
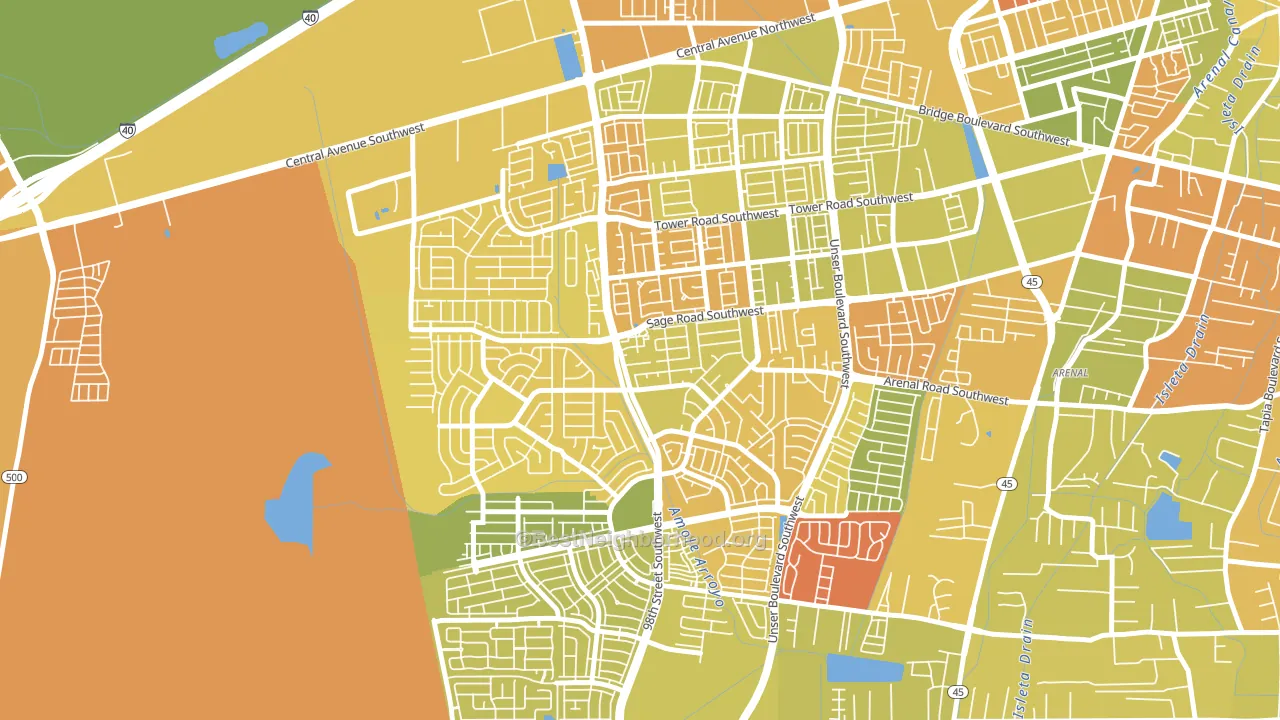
About 51% of adults in Westgate Hts typically vote, below the U.S. average of about 62%. Among adults in Westgate Hts, ~30% vote Democratic, ~21% Republican, and ~49% don't vote. The map below shows estimated turnout by block group.
How Westgate Hts compares
Among neighborhoods within 5 miles, Westgate Hts leans more Democratic than 5 of 11 neighbors.
Westgate Hts runs about 10 points more Democratic than New Mexico as a whole.
Politics vary noticeably by block within Westgate Hts. The southeast side is the most Democratic-leaning (D+22) and the southwest side is the least Democratic-leaning (D+11), a spread of about 11 points.
Why Westgate Hts leans the way it does
This analysis examined 14,881 data points per neighborhood to find what predicts political lean and turnout. The items below are a few correlations that stood out for Westgate Hts, not a ranked or complete list of what matters most.
Areas with many never-married adults vote Democratic. About 47% of adults in Westgate Hts have never been married, about 18 points above the U.S. average of 29%.
Cancer-screening access and voter turnout
Places with low colon-cancer-screening access tend to turn out at a lower rate; Westgate Hts, Albuquerque, NM sits in the bottom tenth nationally on this measure. Cancer screening does not drive turnout; it reflects income, insurance, and healthcare access.
Why turnout in Westgate Hts looks the way it does
Areas with limited routine healthcare access turn out at lower rates. Westgate Hts is in the bottom quarter nationally for routine-care measures such as insurance coverage, preventive screenings, and dental visits. The uninsured rate here is about 24%, about 8 points above the New Mexico average of 16%. High food insecurity lines up with lower turnout, and about 30% of adults in Westgate Hts report food insecurity, above 83% of neighborhoods. Low high-school completion lines up with lower turnout, and about 80% of adults in Westgate Hts have completed high school, below 85% of neighborhoods. Learn more about the findings and methodology on the political spectrum map.
Nearby Neighborhoods
- Westgate Vecinos, Albuquerque, NM D+19
- Avalon, Albuquerque, NM D+17
- Alamosa, Albuquerque, NM D+25
- Parkway, Albuquerque, NM D+6
- Los Volcanes, Albuquerque, NM D+15
- South Atrisco, South Valley, NM D+20
- West Mesa, Albuquerque, NM D+24
- Tierra Oeste, Albuquerque, NM D+15
- Laurelwood, Albuquerque, NM D+18
- SR Marmon, Albuquerque, NM D+13
Neighborhoods with Similar Populations
- Excelsior, San Francisco, CA D+39
- Downtown Seattle, Seattle, WA D+53
- Wrigley, Long Beach, CA D+42
- City Heights East, San Diego, CA D+31
- Columbia Heights, Washington, DC D+83
- Sugar House, Salt Lake City, UT D+53
- Old Brooklyn, Cleveland, OH D+14
- Beacon Hill, Seattle, WA D+60
- Central Southwest, Houston, TX D+51
- West End, Tacoma, WA D+33
Sources and methodology
Precinct-level voting records used to fit the model come from New Mexico Secretary of State, Bureau of Elections, distributed by the Voting and Election Science Team. Demographic inputs come from the U.S. Census Bureau (ACS 5-year estimates and the 2020 Decennial Census). Health and environmental inputs come from the CDC (PLACES and the Environmental Justice Index). Land cover comes from the USGS and EPA. Election-day and lead-up weather come from PRISM 4km daily grids and the NOAA Global Historical Climatology Network. Mail-voting and election-administration patterns come from the MIT Election Lab's Survey of the Performance of American Elections. Block-group crime detail comes from CrimeGrade. Internet data and modeling support provided by ISPreports.org.
Modeling and analysis by the BestNeighborhood data science team. Full methodology and findings: political spectrum map.
Methodology reviewed by the BestNeighborhood data team. Last updated May 2026.