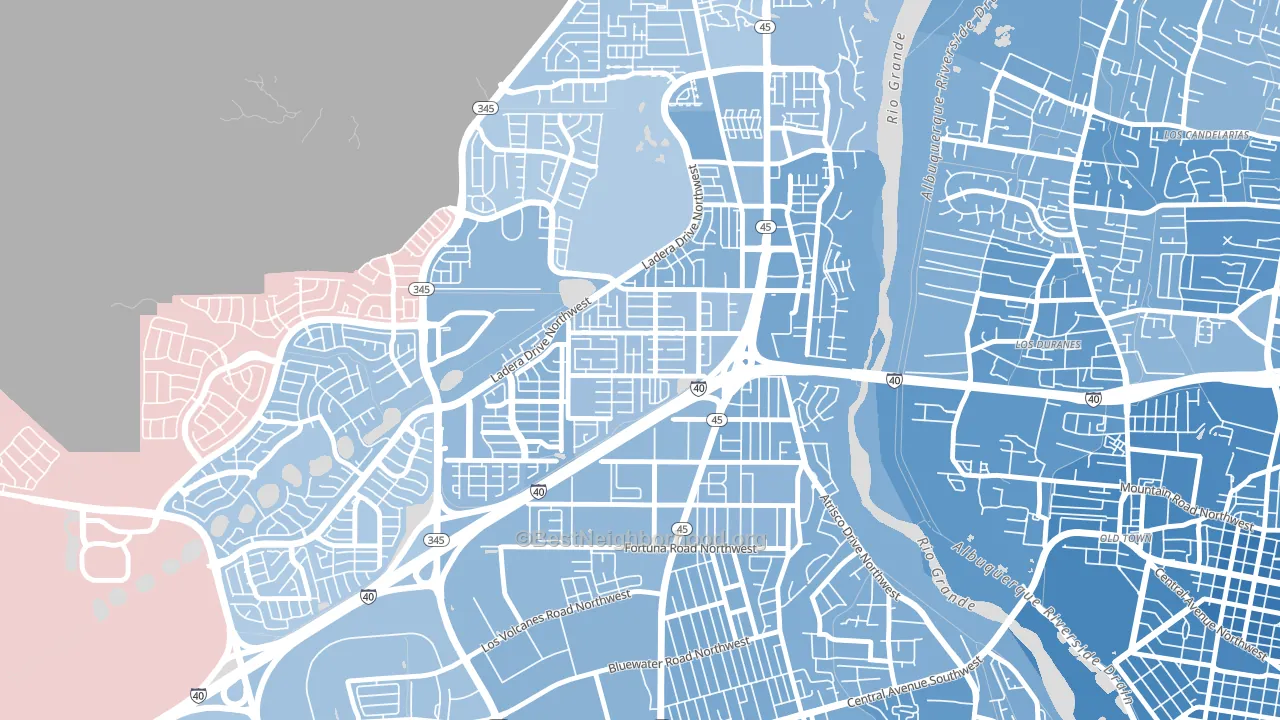
SR Marmon leans slightly Democratic by roughly 14 points: about 57% of voters vote Democratic and 43% Republican.
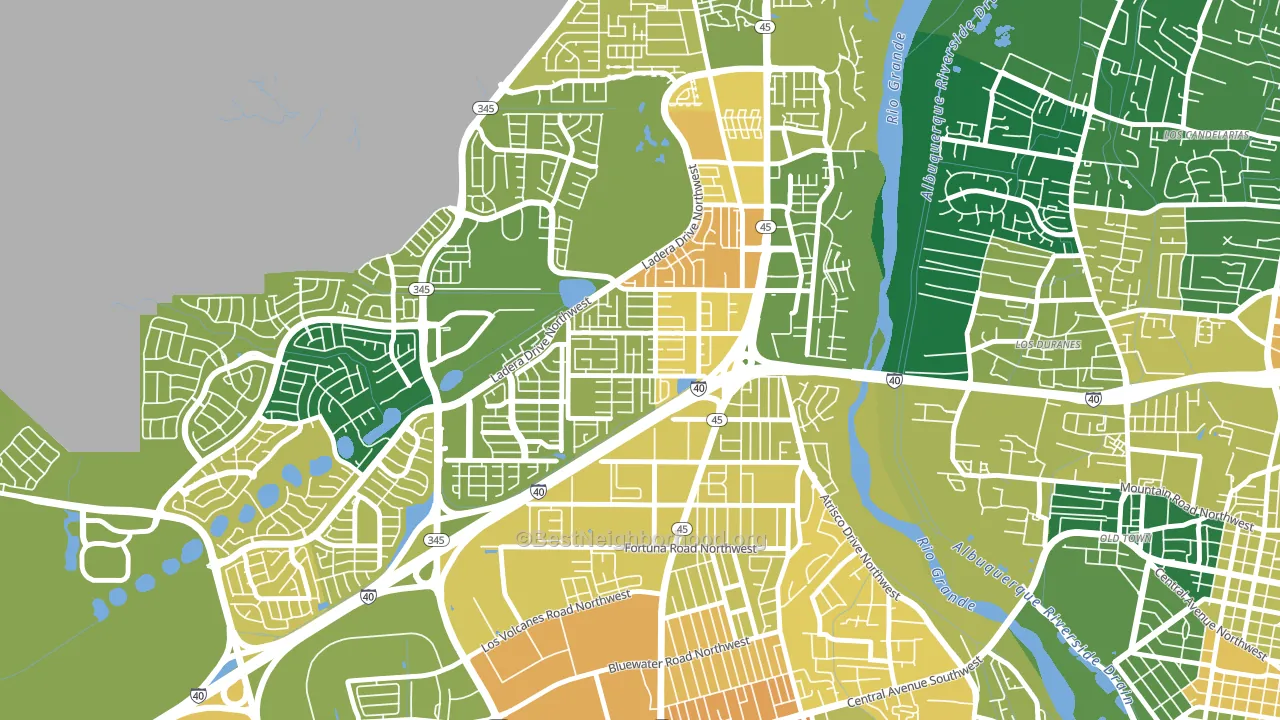
About 65% of adults in SR Marmon typically vote, near the U.S. average of about 62%. Among adults in SR Marmon, ~37% vote Democratic, ~28% Republican, and ~35% don't vote. The map below shows estimated turnout by block group.
How SR Marmon compares
Among neighborhoods within 5 miles, SR Marmon leans more Democratic than 2 of 17 neighbors.
SR Marmon runs about 7 points more Democratic than New Mexico as a whole.
Why SR Marmon leans the way it does
Density, race composition, education, and family structure all sit close to their national averages in SR Marmon. The lean here lands roughly where demographic data alone would predict.
Population density and Democratic lean
Places with high population density tend to lean Democratic; SR Marmon, Albuquerque, NM sits in the top quarter nationally on this measure.
Why turnout in SR Marmon looks the way it does
Turnout in SR Marmon sits close to the national pattern. Routine healthcare access, homeownership, education, and food security all land near their national averages here. Learn more about the findings and methodology on the political spectrum map.
Nearby Neighborhoods
- Laurelwood, Albuquerque, NM D+18
- Ladera West, Albuquerque, NM D+15
- Los Volcanes, Albuquerque, NM D+15
- West Mesa, Albuquerque, NM D+24
- Tierra Oeste, Albuquerque, NM D+15
- Parkway, Albuquerque, NM D+6
- Alamosa, Albuquerque, NM D+25
- Avalon, Albuquerque, NM D+17
- Rio Grande, Albuquerque, NM D+40
- Taylor Ranch, Albuquerque, NM D+15
Neighborhoods with Similar Populations
- Hillsmere Shores, Annapolis Neck, MD D+19
- Starview, Redding, CA R+27
- Lakeview Terrace, Kansas City, MO D+14
- Heritage District, Gilbert, AZ D+5
- Downtown Erie, Erie, PA D+36
- Everroad Park, Columbus, IN R+22
- Downtown Pomona, Pomona, CA D+36
- River Gardens, Sacramento, CA D+33
- Buckingham Park, Willingboro, NJ D+78
- Arnold Heights, Lincoln, NE R+5
Sources and methodology
Precinct-level voting records used to fit the model come from New Mexico Secretary of State, Bureau of Elections, distributed by the Voting and Election Science Team. Demographic inputs come from the U.S. Census Bureau (ACS 5-year estimates and the 2020 Decennial Census). Health and environmental inputs come from the CDC (PLACES and the Environmental Justice Index). Land cover comes from the USGS and EPA. Election-day and lead-up weather come from PRISM 4km daily grids and the NOAA Global Historical Climatology Network. Mail-voting and election-administration patterns come from the MIT Election Lab's Survey of the Performance of American Elections. Block-group crime detail comes from CrimeGrade. Internet data and modeling support provided by ISPreports.org.
Modeling and analysis by the BestNeighborhood data science team. Full methodology and findings: political spectrum map.
Methodology reviewed by the BestNeighborhood data team. Last updated May 2026.