Westside-Santa Barbara is a Democratic stronghold. About 76% of voters here vote Democratic and 24% Republican.
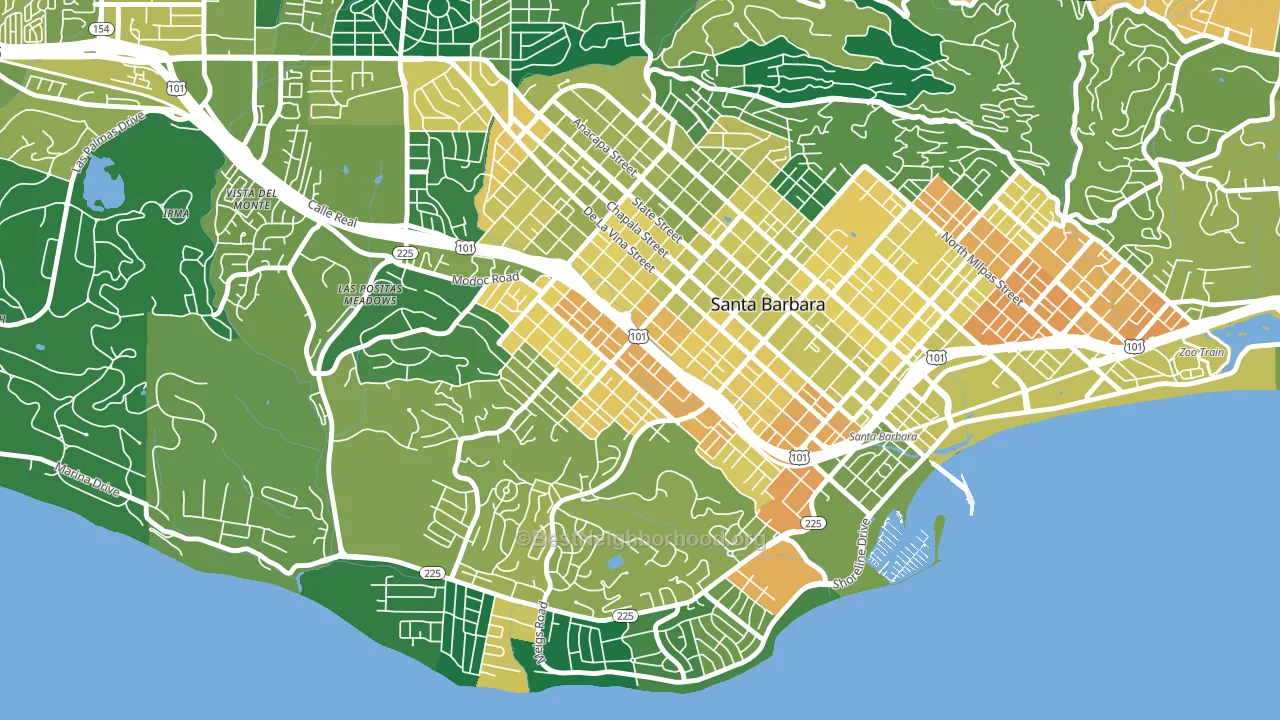
About 50% of adults in Westside-Santa Barbara typically vote, below the U.S. average of about 62%. Among adults in Westside-Santa Barbara, ~38% vote Democratic, ~12% Republican, and ~50% don't vote. The map below shows estimated turnout by block group.
How Westside-Santa Barbara compares
Among neighborhoods within 5 miles, Westside-Santa Barbara leans more Democratic than 4 of 7 neighbors.
Westside-Santa Barbara runs about 32 points more Democratic than California as a whole.
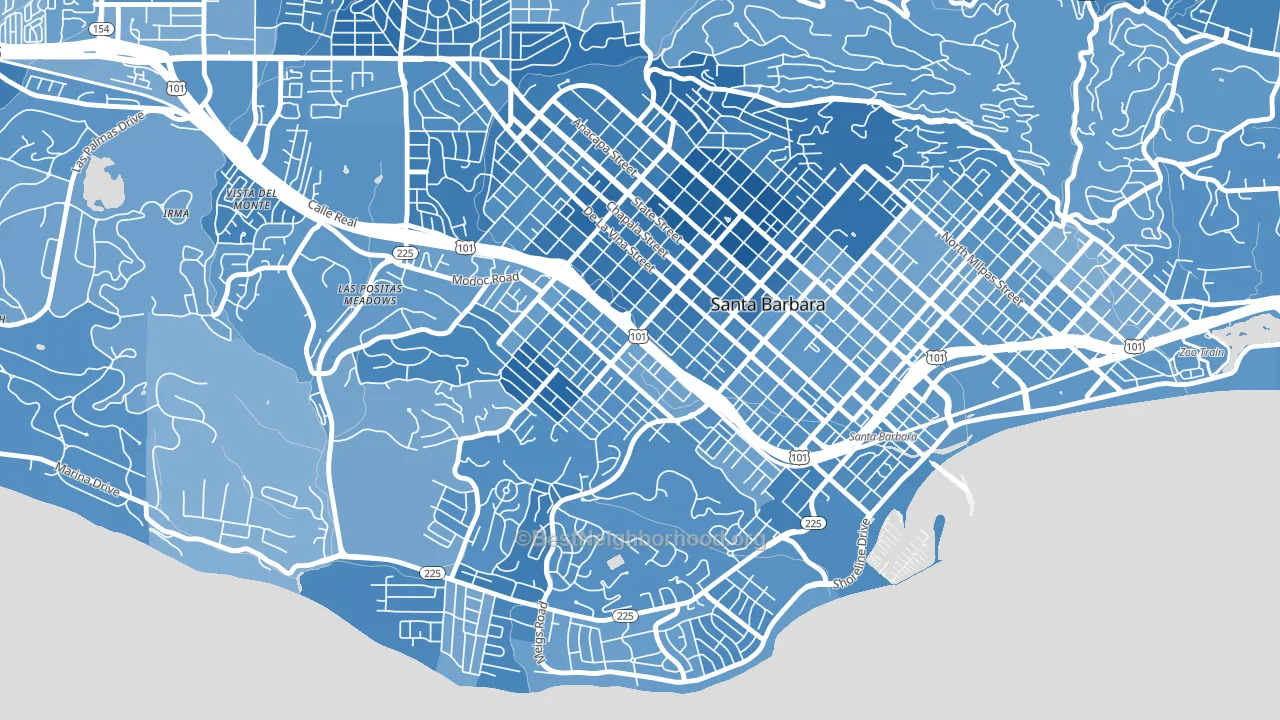
Politics vary noticeably by block within Westside-Santa Barbara. The north side is the most Democratic-leaning (D+61) and the southeast side is the least Democratic-leaning (D+47), a spread of about 14 points.
Why Westside-Santa Barbara leans the way it does
This analysis examined 14,881 data points per neighborhood to find what predicts political lean and turnout. The items below are a few correlations that stood out for Westside-Santa Barbara, not a ranked or complete list of what matters most.
Areas with many never-married adults vote Democratic. About 50% of adults in Westside-Santa Barbara have never been married, about 20 points above the U.S. average of 29%.
Paved land cover and Democratic lean
Places with extensive paved surfaces tend to lean Democratic; Westside-Santa Barbara, Santa Barbara, CA sits in the top quarter nationally on this measure. Paved ground does not change how people vote; it mostly reflects how urban and built-up a place is.
Why turnout in Westside-Santa Barbara looks the way it does
Crowded housing lines up with lower turnout. About 14% of homes in Westside-Santa Barbara have more than one occupant per room, above 96% of neighborhoods. Renters vote less often than owners, and about 74% of households in Westside-Santa Barbara rent, compared to around 49% in nearby neighborhoods. Learn more about the findings and methodology on the political spectrum map.
Nearby Neighborhoods
- Waterfront, Santa Barbara, CA D+55
- Mesa, Santa Barbara, CA D+52
- Lower East, Santa Barbara, CA D+57
- Las Positas, Santa Barbara, CA D+45
- Eastside Santa Barbara, Santa Barbara, CA D+44
- Upper State, Santa Barbara, CA D+51
- Riviera, Santa Barbara, CA D+49
- Sea View Estates, Oxnard, CA D+22
- Via Marina, Oxnard, CA D+25
- Sierra Linda, Oxnard, CA D+31
Neighborhoods with Similar Populations
- Chevy Chase, Washington, DC D+79
- East Side, Chicago, IL D+33
- Tribeca, Manhattan, NY D+64
- Historic Filipinotown, Los Angeles, CA D+44
- Eldridge-West Oaks, Houston, TX D+34
- Hollis, Queens, NY D+49
- Highland Park, Los Angeles, CA D+52
- Sommerset West-Elmonica South, Hillsboro, OR D+44
- Ukrainian Village, Chicago, IL D+72
- Fort Totten-Upper Northeast, Washington, DC D+83
Sources and methodology
Precinct-level voting records used to fit the model come from California Secretary of State, Elections, distributed by the Voting and Election Science Team. Demographic inputs come from the U.S. Census Bureau (ACS 5-year estimates and the 2020 Decennial Census). Health and environmental inputs come from the CDC (PLACES and the Environmental Justice Index). Land cover comes from the USGS and EPA. Election-day and lead-up weather come from PRISM 4km daily grids and the NOAA Global Historical Climatology Network. Mail-voting and election-administration patterns come from the MIT Election Lab's Survey of the Performance of American Elections. Block-group crime detail comes from CrimeGrade. Internet data and modeling support provided by ISPreports.org.
Modeling and analysis by the BestNeighborhood data science team. Full methodology and findings: political spectrum map.
Methodology reviewed by the BestNeighborhood data team. Last updated May 2026.