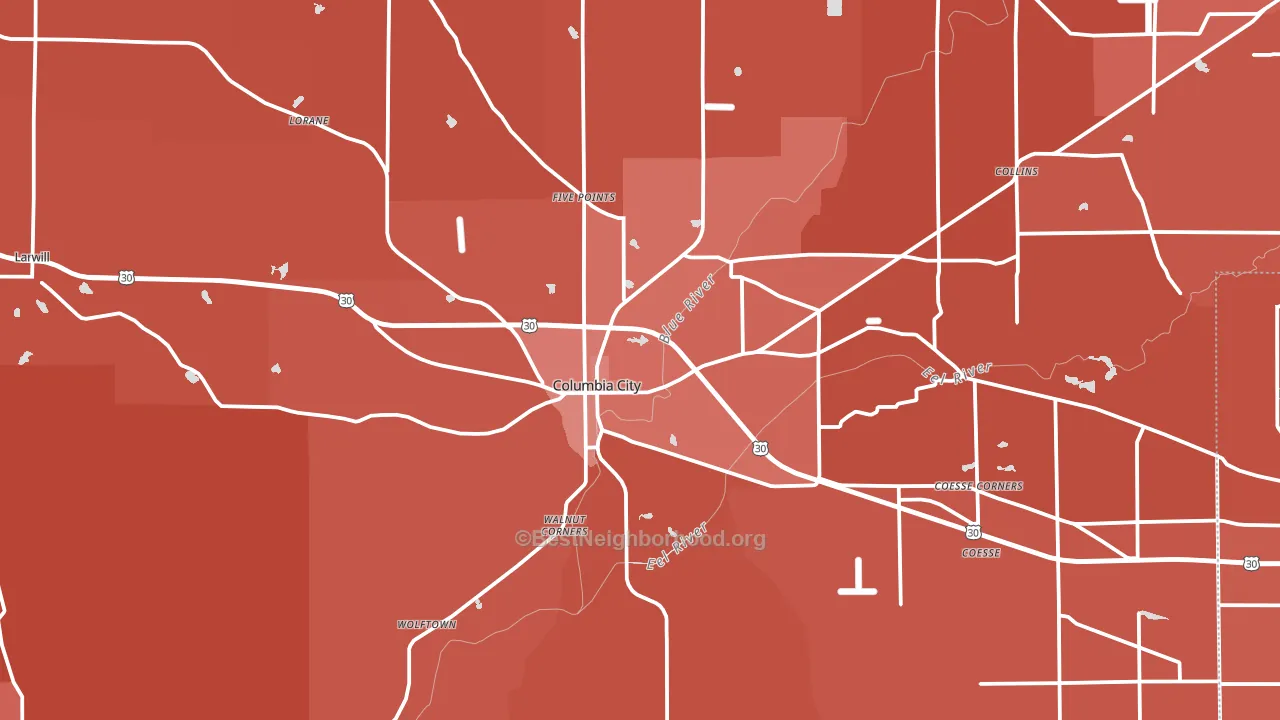
Whitley County is a Republican stronghold. About 24% of voters here vote Democratic and 76% Republican.
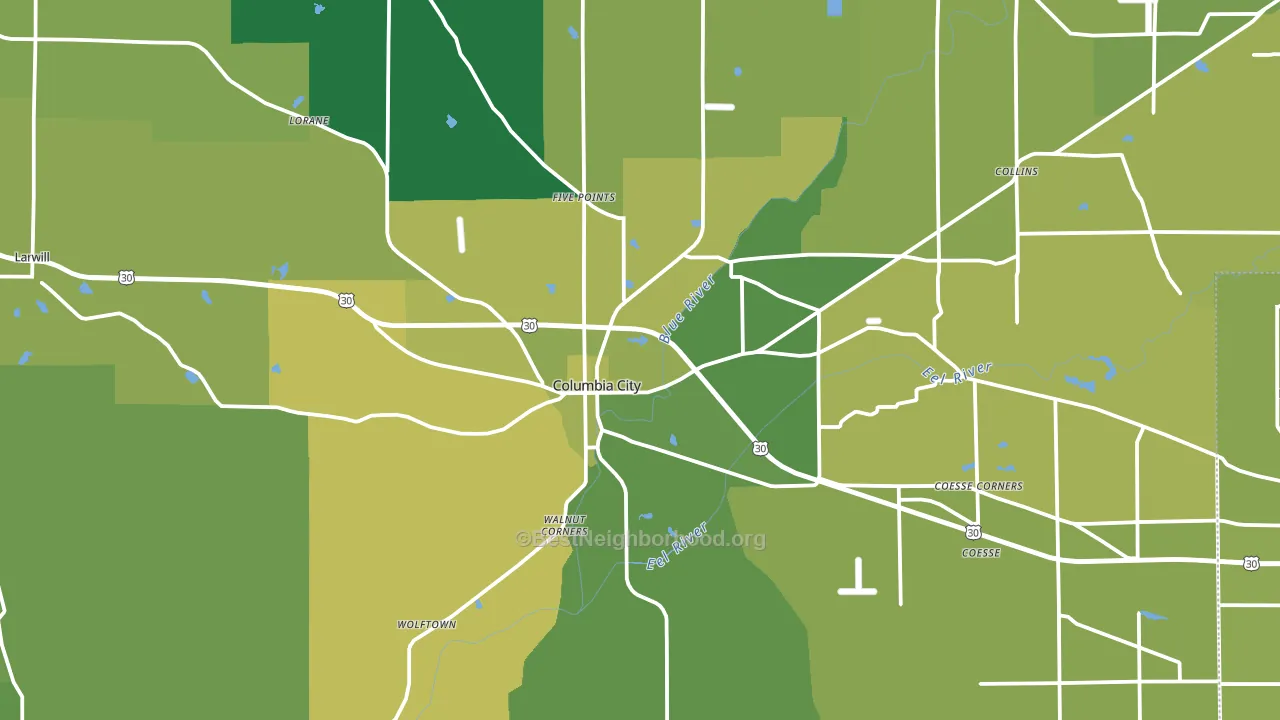
About 77% of adults in Whitley County typically vote, above the U.S. average of about 62%. Among adults in Whitley County, ~18% vote Democratic, ~59% Republican, and ~23% don't vote. The map below shows estimated turnout by block group.
How Whitley County compares
Among counties within 50 miles, Whitley County leans more Republican than 13 of 17 neighbors.
Whitley County runs about 32 points more Republican than Indiana as a whole.
Why Whitley County leans the way it does
This analysis examined 14,881 data points per county to find what predicts political lean and turnout. The items below are a few correlations that stood out for Whitley County, not a ranked or complete list of what matters most.
Car-dependent areas vote Republican. About 82% of residents in Whitley County drive to work alone, about 8 points above the U.S. average of 74%. A high family-household share predicts Republican voting, and about 71% of households in Whitley County are family households, above 82% of counties.
Preventive-care access and voter turnout
Places with strong routine preventive-care access tend to turn out at a higher rate; Whitley County, IN sits above the national average on this measure. Dental visits do not drive turnout; the rate reflects income, insurance, and healthcare access, which line up with who votes.
Why turnout in Whitley County looks the way it does
Areas with strong routine healthcare access turn out at higher rates. Whitley County is in the top quarter nationally for routine-care measures such as insurance coverage, preventive screenings, and dental visits. The dental-visit rate here is about 64%, above 71% of counties. Homeowners vote more often than renters, and about 83% of households in Whitley County own their home, above 90% of counties. Learn more about the findings and methodology on the political spectrum map.
Nearby Counties
- Noble County, IN R+49
- Allen County, IN R+5
- Kosciusko County, IN R+47
- Huntington County, IN R+45
- Wabash County, IN R+48
- DeKalb County, IN R+49
- Wells County, IN R+56
- LaGrange County, IN R+63
- Fulton County, IN R+51
- Elkhart County, IN R+28
Counties with Similar Populations
- Miami County, KS R+39
- Monroe County, MS R+31
- Scotland County, NC D+2
- Preston County, WV R+58
- Lee County, IL R+21
- Emmet County, MI R+10
- Ford County, KS R+26
- Platte County, NE R+48
- Marshall County, TN R+54
- Christian County, IL R+45
Sources and methodology
Precinct-level voting records used to fit the model come from Indiana Secretary of State, Elections, distributed by the Voting and Election Science Team. Demographic inputs come from the U.S. Census Bureau (ACS 5-year estimates and the 2020 Decennial Census). Health and environmental inputs come from the CDC (PLACES and the Environmental Justice Index). Land cover comes from the USGS and EPA. Election-day and lead-up weather come from PRISM 4km daily grids and the NOAA Global Historical Climatology Network. Mail-voting and election-administration patterns come from the MIT Election Lab's Survey of the Performance of American Elections. Block-group crime detail comes from CrimeGrade. Internet data and modeling support provided by ISPreports.org.
Modeling and analysis by the BestNeighborhood data science team. Full methodology and findings: political spectrum map.
Methodology reviewed by the BestNeighborhood data team. Last updated May 2026.