Wilbur is a Democratic stronghold. About 85% of voters here vote Democratic and 15% Republican.
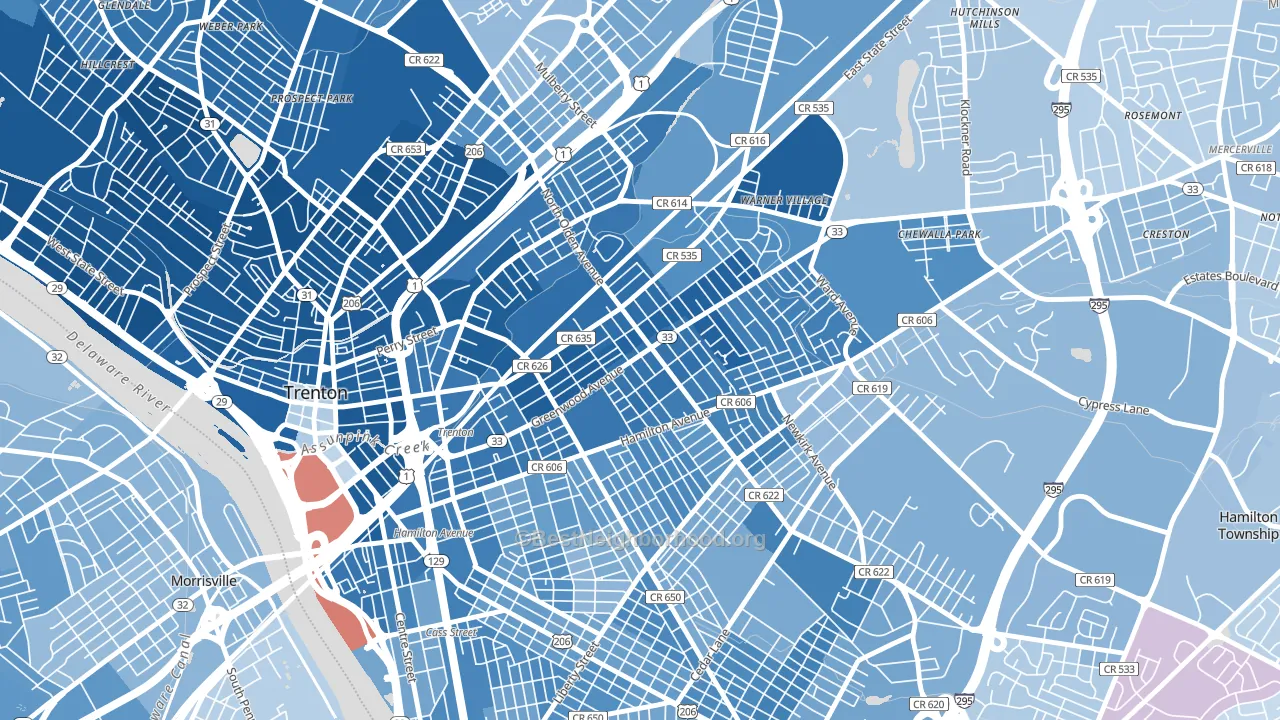
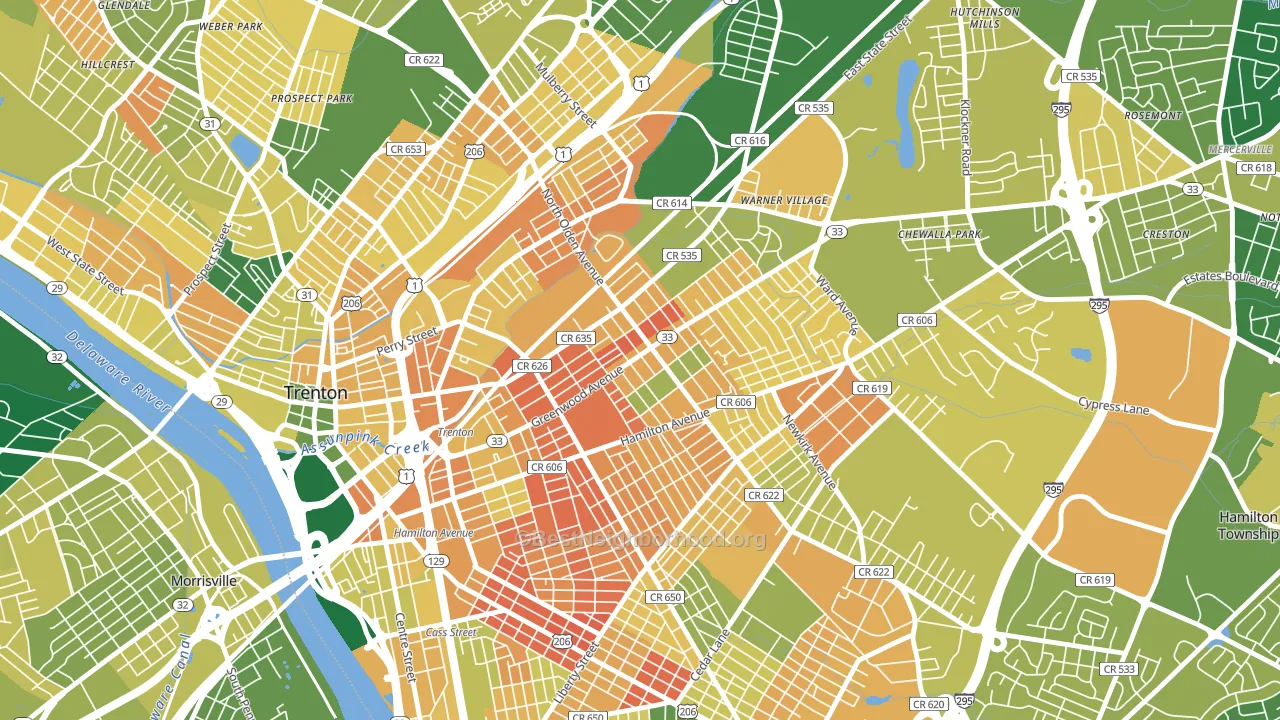
About 35% of adults in Wilbur typically vote, below the U.S. average of about 62%. Among adults in Wilbur, ~30% vote Democratic, ~5% Republican, and ~65% don't vote. The map below shows estimated turnout by block group.
How Wilbur compares
Among neighborhoods within 5 miles, Wilbur leans more Democratic than 7 of 12 neighbors.
Wilbur runs about 65 points more Democratic than New Jersey as a whole.
Politics vary noticeably by block within Wilbur. The northeast side is the most Democratic-leaning (D+74) and the southeast side is the least Democratic-leaning (D+63), a spread of about 11 points.
Why Wilbur leans the way it does
This analysis examined 14,881 data points per neighborhood to find what predicts political lean and turnout. The items below are a few correlations that stood out for Wilbur, not a ranked or complete list of what matters most.
Areas with many never-married adults vote Democratic. About 49% of adults in Wilbur have never been married, modestly above similar-sized neighborhoods (around 43%).
Population density and Democratic lean
Places with high population density tend to lean Democratic; Wilbur, Trenton, NJ sits in the top tenth nationally on this measure.
Why turnout in Wilbur looks the way it does
Areas with limited routine healthcare access turn out at lower rates. Wilbur is in the bottom quarter nationally for routine-care measures such as insurance coverage, preventive screenings, and dental visits. The dental-visit rate here is about 47%, about 21 points below the New Jersey average of 67%. Renters vote less often than owners, and about 68% of households in Wilbur rent, about 43 points above the U.S. average of 25%. High food insecurity lines up with lower turnout, and about 38% of adults in Wilbur report food insecurity, above 91% of neighborhoods. Learn more about the findings and methodology on the political spectrum map.
Nearby Neighborhoods
- Villa Park, Trenton, NJ D+39
- Greenwood and Hamilton, Trenton, NJ D+64
- Chambersburg, Trenton, NJ D+39
- Top Road, Trenton, NJ D+36
- North Trenton, Trenton, NJ D+79
- Franklin Park, Trenton, NJ D+34
- South Trenton, Trenton, NJ D+45
- Chestnut Park, Trenton, NJ D+42
- Central West, Trenton, NJ D+79
- Downtown Trenton, Trenton, NJ D+76
Neighborhoods with Similar Populations
- Ironwood Terrace, Glendale, AZ D+27
- Kensington, Kansas City, KS D+36
- Arlington Manor, Jacksonville, FL D+15
- Floresta Gardens-Bradrick, San Leandro, CA D+41
- Walnut Grove - Shelby Farms PD, Germantown, TN R+15
- Shannon Park, Charlotte, NC D+59
- Mt. Park, Lake Oswego, OR D+52
- Aurora Knolls-Hutchinson Heights, Aurora, CO D+25
- West University, Eugene, OR D+62
- South Burlington North, South Burlington, VT D+36
Sources and methodology
Precinct-level voting records used to fit the model come from New Jersey Division of Elections, distributed by the Voting and Election Science Team. Demographic inputs come from the U.S. Census Bureau (ACS 5-year estimates and the 2020 Decennial Census). Health and environmental inputs come from the CDC (PLACES and the Environmental Justice Index). Land cover comes from the USGS and EPA. Election-day and lead-up weather come from PRISM 4km daily grids and the NOAA Global Historical Climatology Network. Mail-voting and election-administration patterns come from the MIT Election Lab's Survey of the Performance of American Elections. Block-group crime detail comes from CrimeGrade. Internet data and modeling support provided by ISPreports.org.
Modeling and analysis by the BestNeighborhood data science team. Full methodology and findings: political spectrum map.
Methodology reviewed by the BestNeighborhood data team. Last updated May 2026.