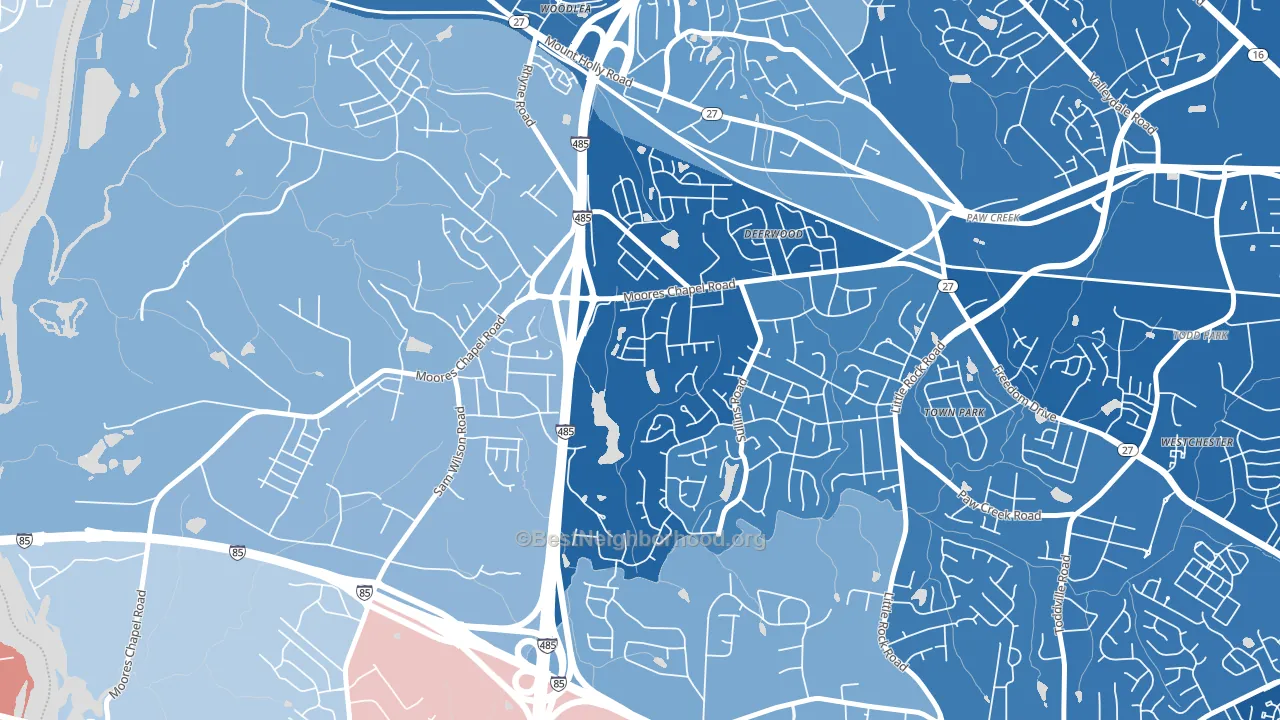
Wildwood is a Democratic stronghold. About 75% of voters here vote Democratic and 25% Republican.
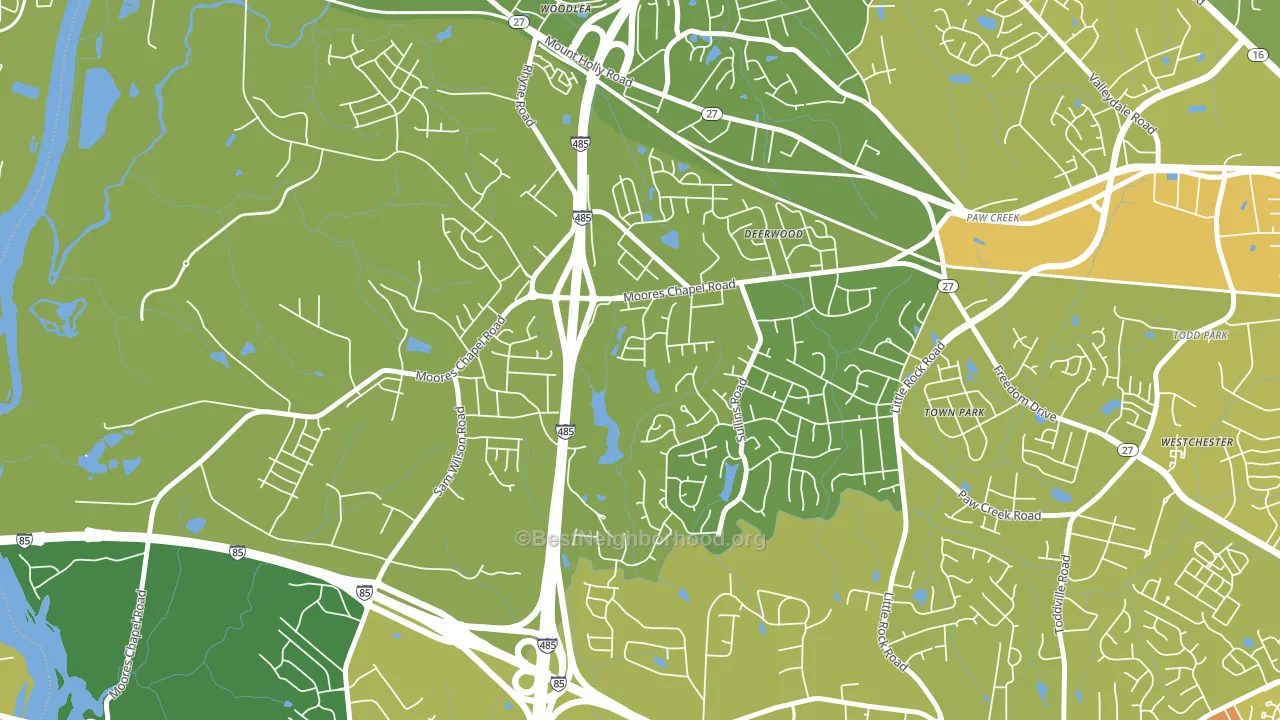
About 67% of adults in Wildwood typically vote, near the U.S. average of about 62%. Among adults in Wildwood, ~50% vote Democratic, ~17% Republican, and ~33% don't vote. The map below shows estimated turnout by block group.
How Wildwood compares
Among neighborhoods within 5 miles, Wildwood leans more Democratic than 3 of 8 neighbors.
Wildwood runs about 54 points more Democratic than North Carolina as a whole. North Carolina leans Republican overall, while Wildwood is one of the few Democratic-leaning pockets.
Politics vary noticeably by block within Wildwood. The east side is the most Democratic-leaning (D+61) and the northwest side is the least Democratic-leaning (D+23), a spread of about 38 points.
Why Wildwood leans the way it does
This analysis examined 14,881 data points per neighborhood to find what predicts political lean and turnout. The items below are a few correlations that stood out for Wildwood, not a ranked or complete list of what matters most.
Wildwood votes against the grain of North Carolina. North Carolina leans Republican overall, while Wildwood runs about 54 points more Democratic. Rural majority-Black areas vote Democratic, and about 44% of residents in Wildwood are Black or African American, above 88% of neighborhoods.
Homeownership and voter turnout
Places with homeowner-heavy households tend to turn out at a higher rate; Wildwood, Charlotte, NC sits above the national average on this measure.
Why turnout in Wildwood looks the way it does
Turnout in Wildwood sits close to the national pattern. Routine healthcare access, homeownership, education, and food security all land near their national averages here. Learn more about the findings and methodology on the political spectrum map.
Nearby Neighborhoods
- Pawtuckett, Charlotte, NC D+46
- Coulwood West, Charlotte, NC D+42
- Westchester, Charlotte, NC D+72
- Toddville Road, Charlotte, NC D+64
- Oakdale South, Charlotte, NC D+60
- Harwood Lane, Charlotte, NC D+37
- Thomasboro-Hoskins, Charlotte, NC D+75
- Enderly Park, Charlotte, NC D+80
- Ashley Park, Charlotte, NC D+66
- Firestone-Garden Park, Charlotte, NC D+78
Neighborhoods with Similar Populations
- University Commons, San Marcos, CA D+10
- Boulevard Bluffs, Everett, WA D+17
- Pasadena Bear Creek Estates, St. Petersburg, FL Even
- Darnestown, Gaithersburg, MD D+25
- Selby-on-the-Bay, Mayo, MD R+13
- Legacy Place, Alafaya, FL D+13
- Pepperidge, Augusta, GA D+84
- Fairmount, Eugene, OR D+73
- Spring Park, Jacksonville, FL D+15
- Jefferson Park, Denver, CO D+57
Sources and methodology
Precinct-level voting records used to fit the model come from North Carolina State Board of Elections, distributed by the Voting and Election Science Team. Demographic inputs come from the U.S. Census Bureau (ACS 5-year estimates and the 2020 Decennial Census). Health and environmental inputs come from the CDC (PLACES and the Environmental Justice Index). Land cover comes from the USGS and EPA. Election-day and lead-up weather come from PRISM 4km daily grids and the NOAA Global Historical Climatology Network. Mail-voting and election-administration patterns come from the MIT Election Lab's Survey of the Performance of American Elections. Block-group crime detail comes from CrimeGrade. Internet data and modeling support provided by ISPreports.org.
Modeling and analysis by the BestNeighborhood data science team. Full methodology and findings: political spectrum map.
Methodology reviewed by the BestNeighborhood data team. Last updated May 2026.