Selby-on-the-Bay leans slightly Republican by roughly 14 points: about 43% of voters vote Democratic and 57% Republican.
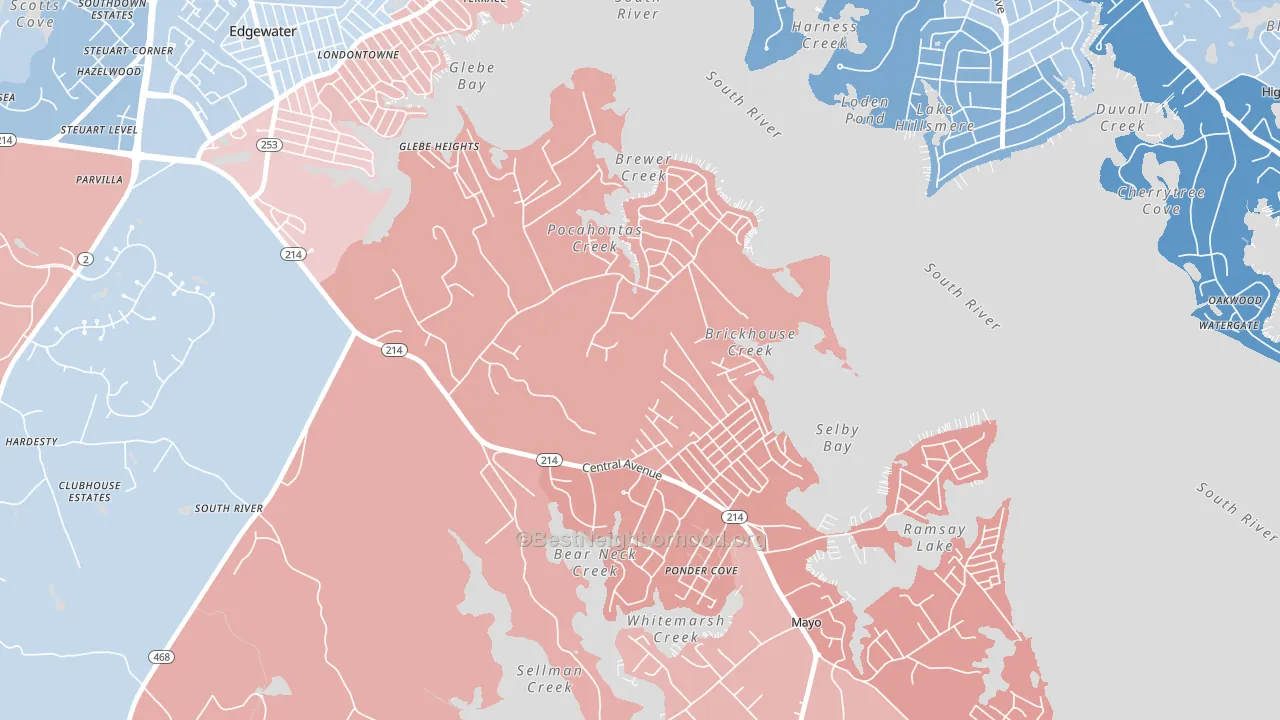
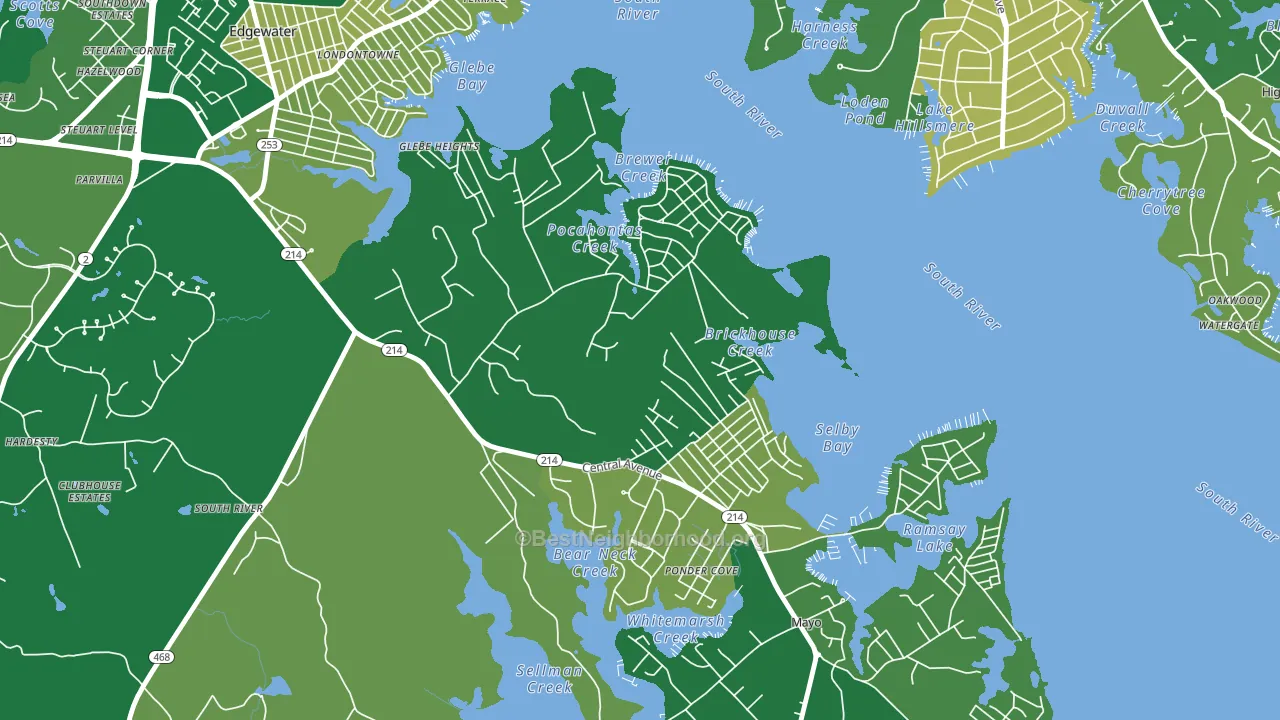
About 95% of adults in Selby-on-the-Bay typically vote, above the U.S. average of about 62%. Among adults in Selby-on-the-Bay, ~41% vote Democratic, ~54% Republican, and ~5% don't vote. The map below shows estimated turnout by block group.
How Selby-on-the-Bay compares
Among neighborhoods within 5 miles, Selby-on-the-Bay is the most Republican-leaning.
Selby-on-the-Bay runs about 42 points more Republican than Maryland as a whole. Maryland leans Democratic overall, while Selby-on-the-Bay is one of the few Republican-leaning pockets.
Why Selby-on-the-Bay leans the way it does
This analysis examined 14,881 data points per neighborhood to find what predicts political lean and turnout. The items below are a few correlations that stood out for Selby-on-the-Bay, not a ranked or complete list of what matters most.
Rural areas with a high white share vote Republican. Selby-on-the-Bay sits in the bottom quarter on density and about 89% of residents are non-Hispanic white, about 26 points above the Maryland average of 63%. A high family-household share predicts Republican voting, and about 81% of households in Selby-on-the-Bay are family households, above 88% of neighborhoods. Selby-on-the-Bay runs against the grain of Maryland, a Republican-leaning pocket in a Democratic-leaning state.
Developed land and Republican lean
Places with a rural land-use pattern tend to lean Republican; Selby-on-the-Bay, Mayo, MD sits in the bottom quarter nationally on this measure. Developed land does not change how people vote; it mostly reflects how urban a place is.
Why turnout in Selby-on-the-Bay looks the way it does
Homeowners vote more often than renters. About 90% of households in Selby-on-the-Bay own their home, about 13 points above the Maryland average of 77%. Learn more about the findings and methodology on the political spectrum map.
Nearby Neighborhoods
- Londontowne, Edgewater, MD Even
- Hillsmere Shores, Annapolis Neck, MD D+19
- Downtown Annapolis, Annapolis, MD D+46
- Greater Upper Marlboro, Brock Hall, MD D+81
- Green Haven, Pasadena, MD R+13
- South Gate, Glen Burnie, MD D+32
- School Gardens, Riviera Beach, MD R+19
- Lanham-Seabrook, Lanham, MD D+67
- Goddard, Seabrook, MD D+71
- Greater Landover, Landover, MD D+78
Neighborhoods with Similar Populations
- Fairmount, Eugene, OR D+73
- Legacy Place, Alafaya, FL D+13
- Pasadena Bear Creek Estates, St. Petersburg, FL Even
- Spring Park, Jacksonville, FL D+15
- Boulevard Bluffs, Everett, WA D+17
- Oldtown, Baltimore, MD D+77
- South Poplar, Allentown, PA D+17
- University Commons, San Marcos, CA D+10
- Wildwood, Charlotte, NC D+51
- Berea, Baltimore, MD D+87
Sources and methodology
Precinct-level voting records used to fit the model come from Maryland State Board of Elections, distributed by the Voting and Election Science Team. Demographic inputs come from the U.S. Census Bureau (ACS 5-year estimates and the 2020 Decennial Census). Health and environmental inputs come from the CDC (PLACES and the Environmental Justice Index). Land cover comes from the USGS and EPA. Election-day and lead-up weather come from PRISM 4km daily grids and the NOAA Global Historical Climatology Network. Mail-voting and election-administration patterns come from the MIT Election Lab's Survey of the Performance of American Elections. Block-group crime detail comes from CrimeGrade. Internet data and modeling support provided by ISPreports.org.
Modeling and analysis by the BestNeighborhood data science team. Full methodology and findings: political spectrum map.
Methodology reviewed by the BestNeighborhood data team. Last updated May 2026.