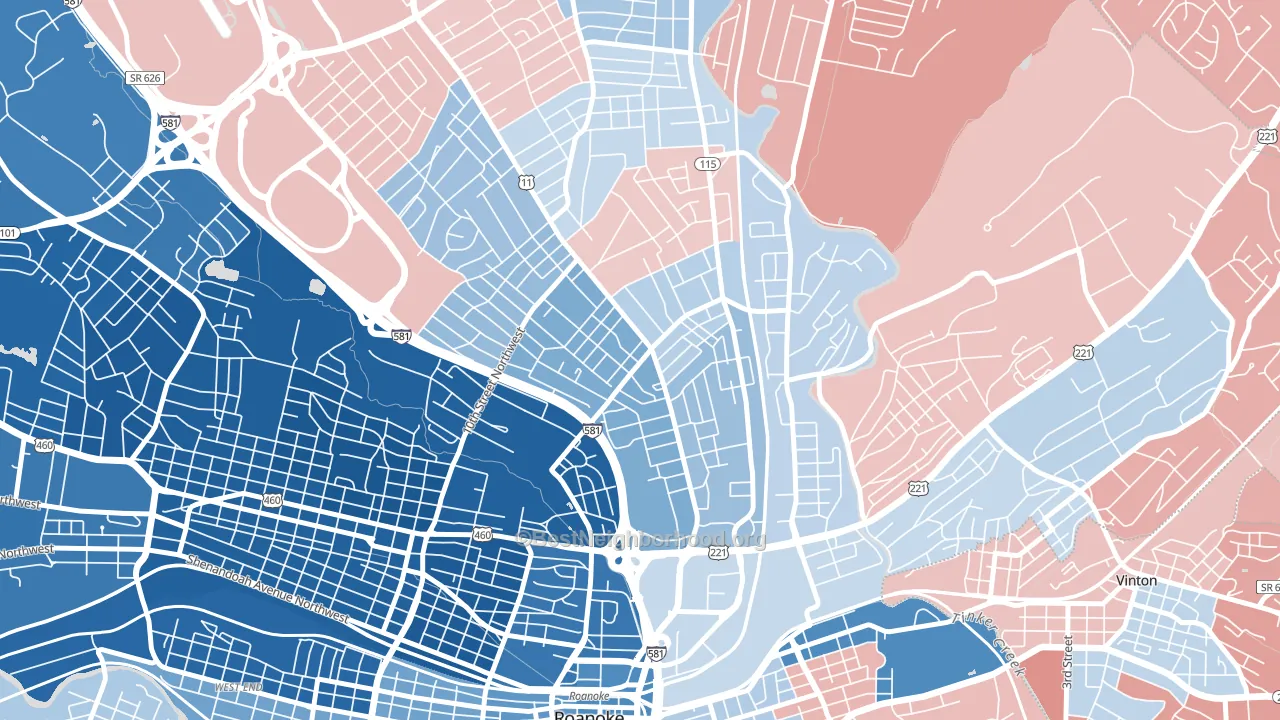
Williamson Road leans Democratic by roughly 20 points: about 60% of voters vote Democratic and 40% Republican.
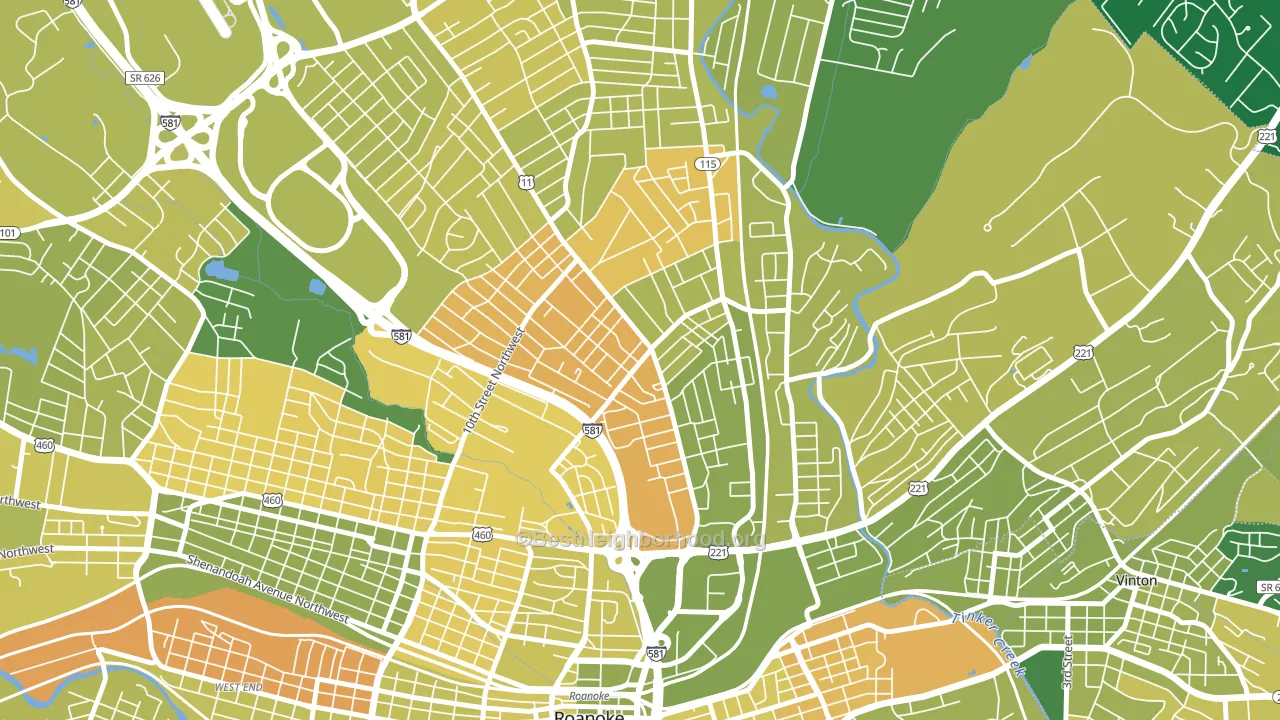
About 52% of adults in Williamson Road typically vote, below the U.S. average of about 62%. Among adults in Williamson Road, ~31% vote Democratic, ~21% Republican, and ~48% don't vote. The map below shows estimated turnout by block group.
How Williamson Road compares
Among neighborhoods within 5 miles, Williamson Road leans more Democratic than 5 of 7 neighbors.
Williamson Road runs about 15 points more Democratic than Virginia as a whole.
Politics vary noticeably by block within Williamson Road. The southwest side is the most Democratic-leaning (D+62) and the north side is the least Democratic-leaning (D+8), a spread of about 54 points.
Why Williamson Road leans the way it does
This analysis examined 14,881 data points per neighborhood to find what predicts political lean and turnout. The items below are a few correlations that stood out for Williamson Road, not a ranked or complete list of what matters most.
Dense areas vote Democratic. More than 99% of residents in Williamson Road live in densely developed areas, about 64 points above the U.S. average of 36%.
High-school completion, developed land, and voter turnout
Places that combine low high-school-completion share and a heavily developed built environment tend to turn out at a lower rate, as Williamson Road, Roanoke, VA does.
Why turnout in Williamson Road looks the way it does
High-crime urban areas turn out at lower rates, mostly because the housing stress common in those areas makes voting harder. Williamson Road sits in the top 15% nationally on a violent-crime measure. See CrimeGrade for more details. Low high-school completion lines up with lower turnout, and about 78% of adults in Williamson Road have completed high school, below 87% of neighborhoods. Learn more about the findings and methodology on the political spectrum map.
Nearby Neighborhoods
- Roundhill, Roanoke, VA D+13
- Preston Park, Roanoke, VA Even
- Melrose-Rugby, Roanoke, VA D+81
- Belmont, Roanoke, VA D+3
- Raleigh Court, Roanoke, VA D+22
- South Roanoke, Roanoke, VA D+16
- Colonial Avenue Area, Roanoke, VA D+20
- Kabrich Crescent, Blacksburg, VA D+37
- Hethwood-Prices Fork, Blacksburg, VA D+46
- Bedford Hills, Lynchburg, VA R+3
Neighborhoods with Similar Populations
- Hedrick Acres, Tucson, AZ D+53
- Car Town, Kannapolis, NC D+10
- Miller Park, Lynchburg, VA D+37
- Richmond Heights-Orlando, Orlando, FL D+83
- Carlen, Mobile, AL Even
- Bolsa Chica-Heil, Huntington Beach, CA R+10
- Sharon Heights, Menlo Park, CA D+63
- Mayflower Village, Arcadia, CA D+14
- McGilvra, Mercer Island, WA D+52
- Wydewood Estates, Midland, TX R+53
Sources and methodology
Precinct-level voting records used to fit the model come from Virginia Department of Elections, distributed by the Voting and Election Science Team. Demographic inputs come from the U.S. Census Bureau (ACS 5-year estimates and the 2020 Decennial Census). Health and environmental inputs come from the CDC (PLACES and the Environmental Justice Index). Land cover comes from the USGS and EPA. Election-day and lead-up weather come from PRISM 4km daily grids and the NOAA Global Historical Climatology Network. Mail-voting and election-administration patterns come from the MIT Election Lab's Survey of the Performance of American Elections. Block-group crime detail comes from CrimeGrade. Internet data and modeling support provided by ISPreports.org.
Modeling and analysis by the BestNeighborhood data science team. Full methodology and findings: political spectrum map.
Methodology reviewed by the BestNeighborhood data team. Last updated May 2026.