Melrose-Rugby is a Democratic stronghold. About 91% of voters here vote Democratic and 9% Republican.
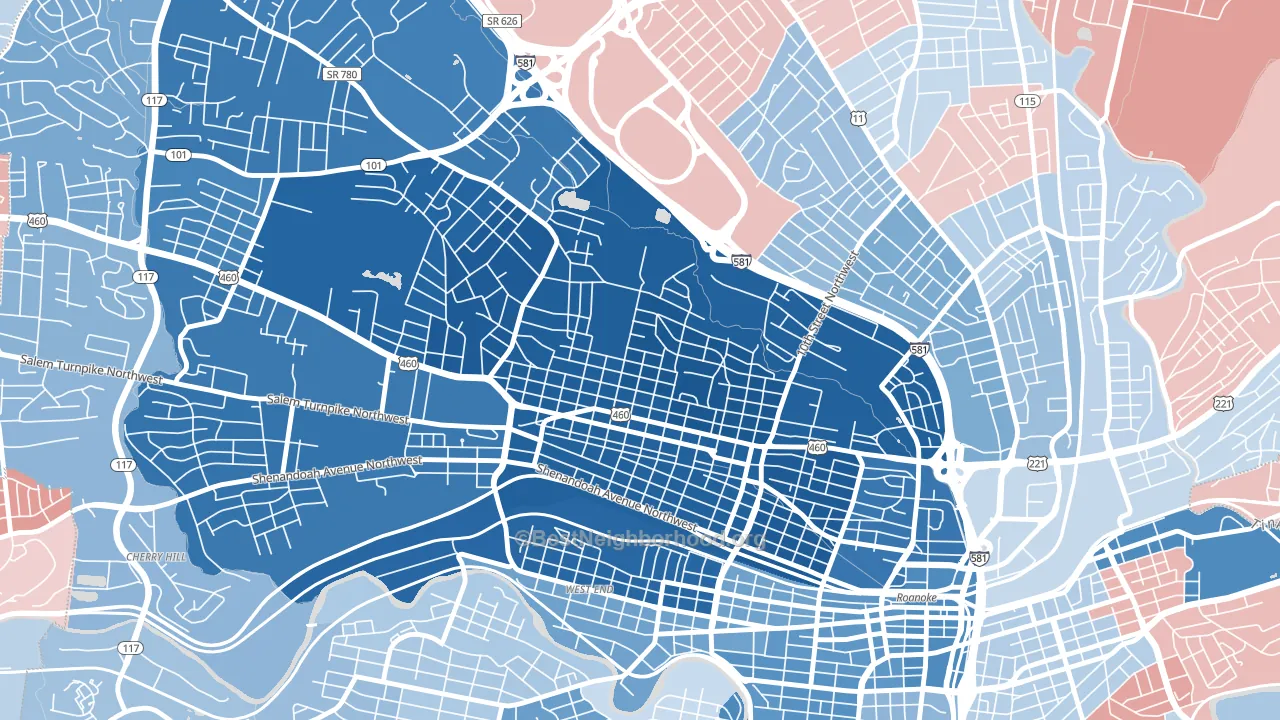
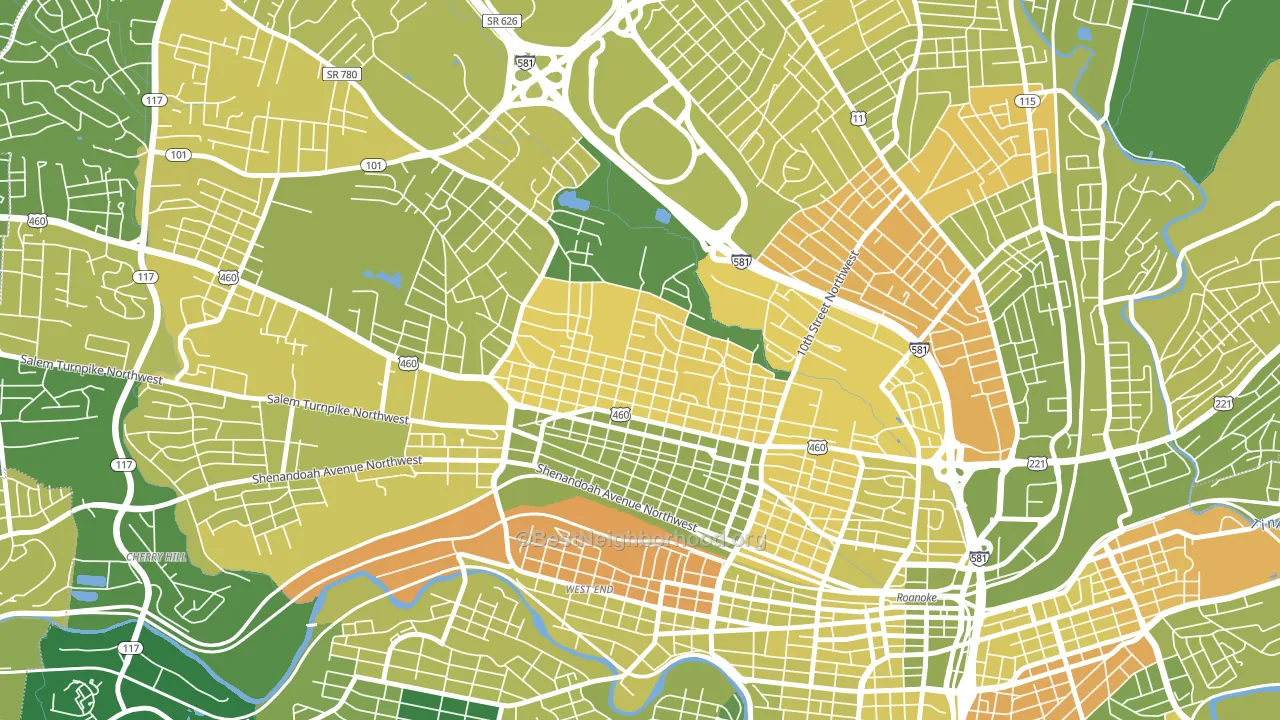
About 54% of adults in Melrose-Rugby typically vote, below the U.S. average of about 62%. Among adults in Melrose-Rugby, ~49% vote Democratic, ~5% Republican, and ~46% don't vote. The map below shows estimated turnout by block group.
How Melrose-Rugby compares
Among neighborhoods within 5 miles, Melrose-Rugby is the most Democratic-leaning.
Melrose-Rugby runs about 75 points more Democratic than Virginia as a whole.
Why Melrose-Rugby leans the way it does
This analysis examined 14,881 data points per neighborhood to find what predicts political lean and turnout. The items below are a few correlations that stood out for Melrose-Rugby, not a ranked or complete list of what matters most.
Areas with many never-married adults vote Democratic. About 64% of adults in Melrose-Rugby have never been married, well above similar-sized neighborhoods (around 44%).
Population density and Democratic lean
Places with high population density tend to lean Democratic; Melrose-Rugby, Roanoke, VA sits above the national average on this measure.
Why turnout in Melrose-Rugby looks the way it does
Areas with high food insecurity turn out at lower rates. About 36% of adults in Melrose-Rugby report food insecurity, about 20 points above the U.S. average of 16%. High-crime urban areas turn out at lower rates, and Melrose-Rugby sits in the top 15% on a violent-crime measure. Learn more about the findings and methodology on the political spectrum map.
Nearby Neighborhoods
- Roundhill, Roanoke, VA D+13
- Williamson Road, Roanoke, VA D+21
- Raleigh Court, Roanoke, VA D+22
- Preston Park, Roanoke, VA Even
- Belmont, Roanoke, VA D+3
- Colonial Avenue Area, Roanoke, VA D+20
- South Roanoke, Roanoke, VA D+16
- Kabrich Crescent, Blacksburg, VA D+37
- Hethwood-Prices Fork, Blacksburg, VA D+46
- Bedford Hills, Lynchburg, VA R+3
Neighborhoods with Similar Populations
- Confederate Point, Jacksonville, FL D+20
- East Meyer, Kansas City, MO D+80
- Wasatch Hollow, Salt Lake City, UT D+67
- Canterbury Green, Fort Wayne, IN D+21
- Sun Willows, Pasco, WA D+13
- Plymouth-Exchange, Rochester, NY D+75
- Downtown Sacramento, Sacramento, CA D+46
- Las Palmas, San Antonio, TX D+35
- Downtown Bradenton, Bradenton, FL D+22
- Boca Teeca, Boca Raton, FL Even
Sources and methodology
Precinct-level voting records used to fit the model come from Virginia Department of Elections, distributed by the Voting and Election Science Team. Demographic inputs come from the U.S. Census Bureau (ACS 5-year estimates and the 2020 Decennial Census). Health and environmental inputs come from the CDC (PLACES and the Environmental Justice Index). Land cover comes from the USGS and EPA. Election-day and lead-up weather come from PRISM 4km daily grids and the NOAA Global Historical Climatology Network. Mail-voting and election-administration patterns come from the MIT Election Lab's Survey of the Performance of American Elections. Block-group crime detail comes from CrimeGrade. Internet data and modeling support provided by ISPreports.org.
Modeling and analysis by the BestNeighborhood data science team. Full methodology and findings: political spectrum map.
Methodology reviewed by the BestNeighborhood data team. Last updated May 2026.