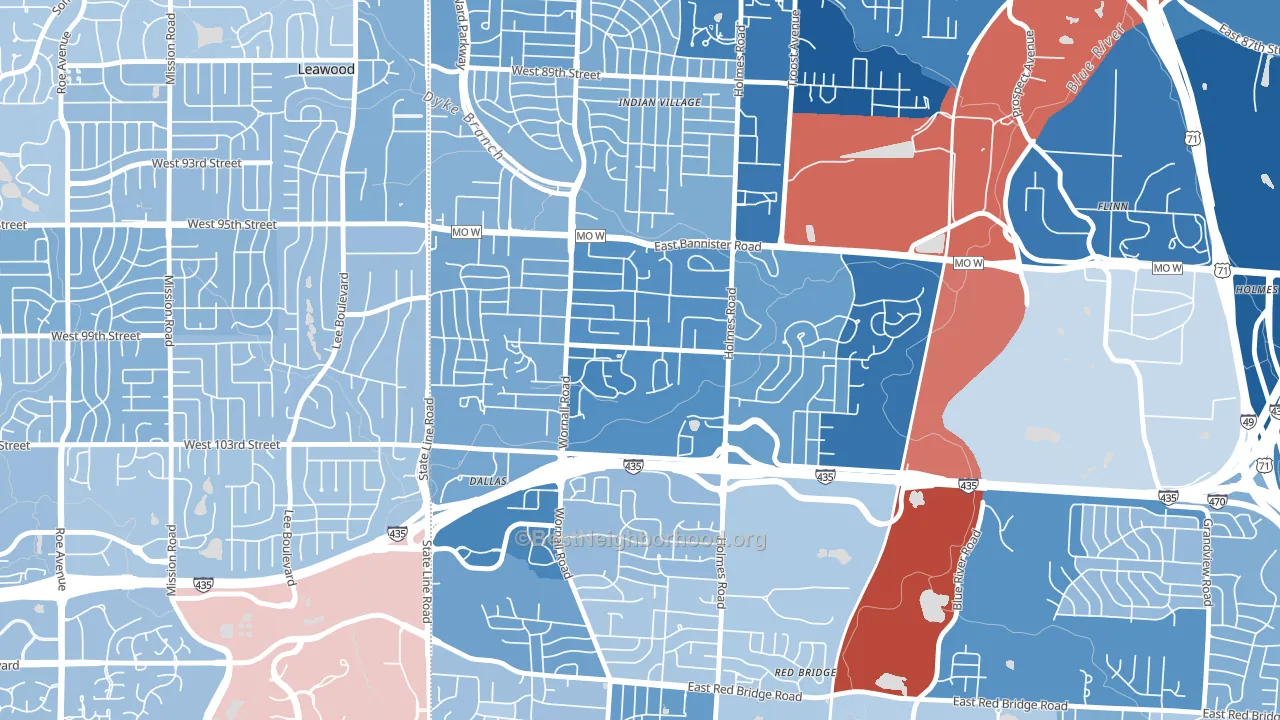
Willow Creek is a Democratic stronghold. About 78% of voters here vote Democratic and 22% Republican.
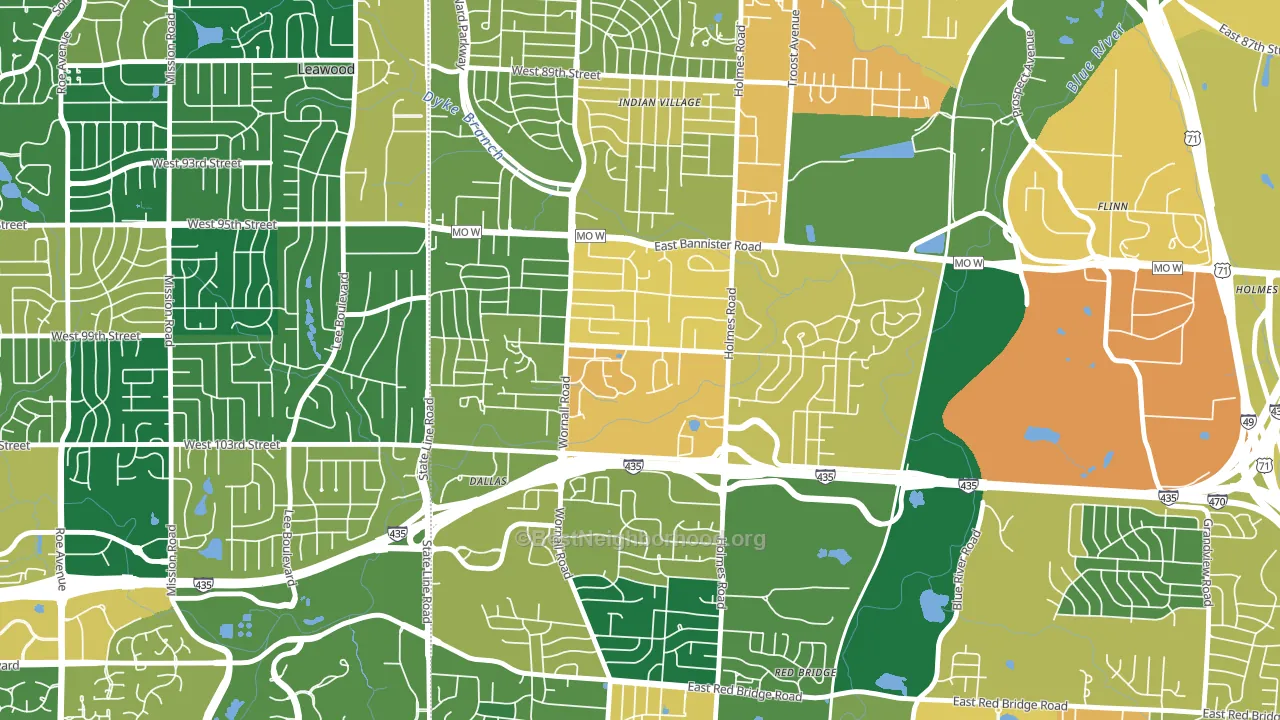
About 50% of adults in Willow Creek typically vote, below the U.S. average of about 62%. Among adults in Willow Creek, ~39% vote Democratic, ~11% Republican, and ~50% don't vote. The map below shows estimated turnout by block group.
How Willow Creek compares
Among neighborhoods within 5 miles, Willow Creek leans more Democratic than 3 of 8 neighbors.
Willow Creek runs about 74 points more Democratic than Missouri as a whole. Missouri leans Republican overall, while Willow Creek is one of the few Democratic-leaning pockets.
Politics vary noticeably by block within Willow Creek. The southwest side is the most Democratic-leaning (D+61) and the northwest side is the least Democratic-leaning (D+51), a spread of about 10 points.
Why Willow Creek leans the way it does
This analysis examined 14,881 data points per neighborhood to find what predicts political lean and turnout. The items below are a few correlations that stood out for Willow Creek, not a ranked or complete list of what matters most.
Willow Creek votes against the grain of Missouri. Missouri leans Republican overall, while Willow Creek runs about 74 points more Democratic. A high never-married share predicts Democratic voting, and about 50% of adults in Willow Creek have never been married, above 82% of neighborhoods.
Homeownership and voter turnout
Places with renter-heavy households tend to turn out at a lower rate; Willow Creek, Kansas City, MO sits in the bottom tenth nationally on this measure.
Why turnout in Willow Creek looks the way it does
Renters vote less often than owners. About 77% of households in Willow Creek rent, about 52 points above the U.S. average of 25%. Learn more about the findings and methodology on the political spectrum map.
Nearby Neighborhoods
- Marlborough Heights-Marlborough Pride, Kansas City, MO D+67
- Mission Lake, Kansas City, MO D+14
- Tower Homes, Kansas City, MO D+67
- Ward Parkway, Kansas City, MO D+48
- East Meyer, Kansas City, MO D+80
- Fairlane, Kansas City, MO D+58
- Blenheim Square, Kansas City, MO D+79
- Hickman Mills, Kansas City, MO D+52
- Ruskin Heights, Kansas City, MO D+58
- Fairwood and Robandee, Kansas City, MO D+55
Neighborhoods with Similar Populations
- Park, Redford, MI D+79
- West Central, Fort Wayne, IN D+31
- Old Town Florissant, Florissant, MO D+30
- Jefferson, Culver City, CA D+59
- Summit Place in Naples, Naples, FL R+17
- Holly Hills, St. Louis, MO D+40
- Millview East, San Marcos, TX D+33
- Braun Station West, San Antonio, TX R+4
- Fairwood and Robandee, Kansas City, MO D+55
- Wellington, Manassas, VA D+13
Sources and methodology
Precinct-level voting records used to fit the model come from Missouri Secretary of State, Elections, distributed by the Voting and Election Science Team. Demographic inputs come from the U.S. Census Bureau (ACS 5-year estimates and the 2020 Decennial Census). Health and environmental inputs come from the CDC (PLACES and the Environmental Justice Index). Land cover comes from the USGS and EPA. Election-day and lead-up weather come from PRISM 4km daily grids and the NOAA Global Historical Climatology Network. Mail-voting and election-administration patterns come from the MIT Election Lab's Survey of the Performance of American Elections. Block-group crime detail comes from CrimeGrade. Internet data and modeling support provided by ISPreports.org.
Modeling and analysis by the BestNeighborhood data science team. Full methodology and findings: political spectrum map.
Methodology reviewed by the BestNeighborhood data team. Last updated May 2026.