
Population 4,176 · Census ACS 2020–24
Choose a measure to map it.Tap a measure to map it. Swipe the row for more. Arrows show the change since 2006–10.
Median age by neighborhoodHistory and comparison ↓︎
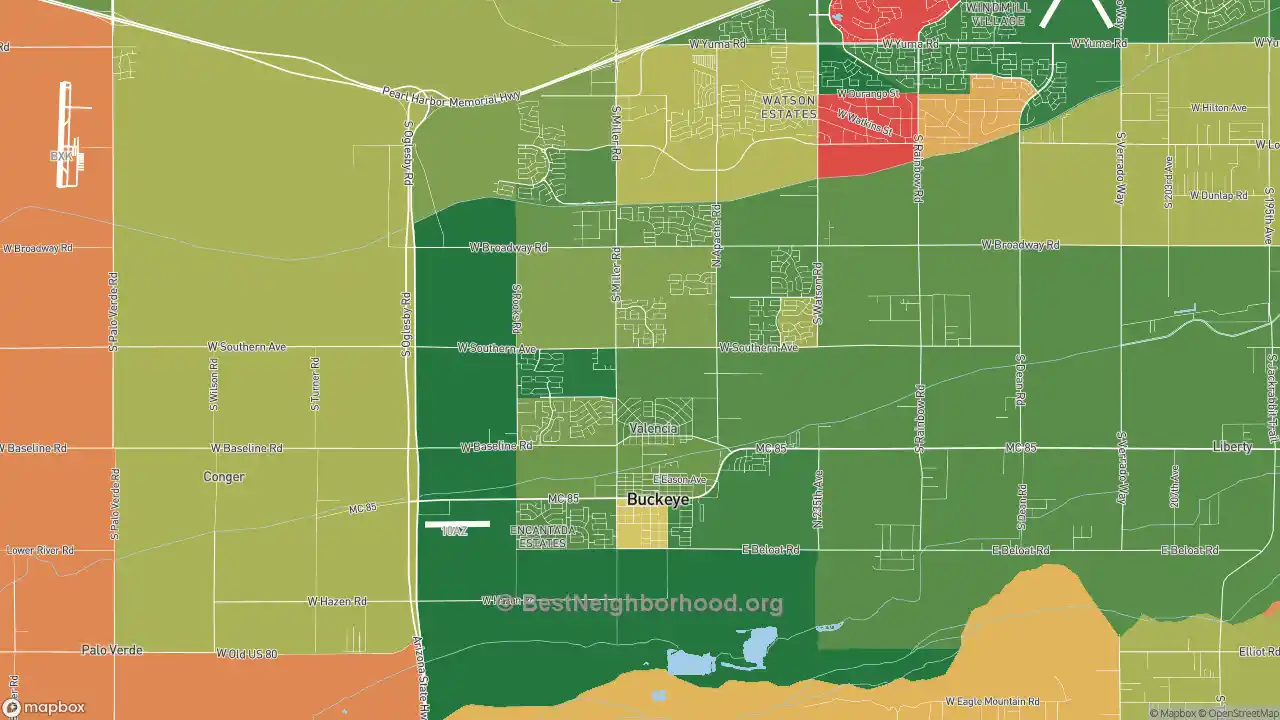
Younger residents
Older residents
Colorblind friendly
off
More maps of Valencia: Best Neighborhoods · Walk Grade · Household income · Home prices · Race · Politics · Traffic noise · Internet
Population and households in Valencia
Household size in Valencia
| Period | Valencia | Buckeye | Phoenix area | Arizona | U.S. |
|---|---|---|---|---|---|
| 2006–10 | 3.00 | 3.10 | 2.83 | 2.77 | 2.68 |
| 2010–14 | 3.05 | 3.28 | 2.91 | 2.84 | 2.73 |
| 2015–19 | 3.50 | 3.42 | 2.91 | 2.82 | 2.71 |
| 2020–24 | 2.97 | 3.22 | 2.80 | 2.70 | 2.65 |
| Change | −0.03 | +0.12 | −0.03 | −0.07 | −0.03 |
Valencia is a place of big households: 2.97 people per home on average, compared with 2.65 nationally. Numbers like that usually point to plenty of families with kids. Even so, the typical household here is smaller than in Buckeye as a whole, where it has 3.22 people.
Household size: the average number of people living in each occupied home. Source: BestNeighborhood calculations from U.S. Census Bureau ACS 5-year block-group estimates (table B25010).
Median age in Valencia
| Period | Valencia | Buckeye | Phoenix area | Arizona | U.S. |
|---|---|---|---|---|---|
| 2006–10 | 29.4 | 33.5 | 35.6 | 36.9 | 37.7 |
| 2010–14 | 33.8 | 34.3 | 36.9 | 38.1 | 38.6 |
| 2015–19 | 30.2 | 35.6 | 38.3 | 39.5 | 39.6 |
| 2020–24 | 36.5 | 36.0 | 39.1 | 40.4 | 40.1 |
| Change | +7.1 | +2.5 | +3.5 | +3.5 | +2.3 |
Valencia is younger than the country as a whole: its median age is 36.5, against 40.1 nationally. The picture is much the same across Buckeye. Since 2006–10, the median age has climbed from 29.4, but in a place this small, survey estimates can swing a lot from one release to the next.
Median age: the age that splits residents into two equal halves. Source: BestNeighborhood calculations from U.S. Census Bureau ACS 5-year block-group estimates (table B01002).
Single-parent households in Valencia
| Period | Valencia | Buckeye | Phoenix area | Arizona | U.S. |
|---|---|---|---|---|---|
| 2006–10 | 18.3% | 14.5% | 13.6% | 13.4% | 12.3% |
| 2010–14 | 18.2% | 13.1% | 14.0% | 13.6% | 12.3% |
| 2015–19 | 18.0% | 12.1% | 12.8% | 12.7% | 11.6% |
| 2020–24 | 12.3% | 12.0% | 12.9% | 12.6% | 11.6% |
| Change | −6.0 pts | −2.4 pts | −0.6 pts | −0.8 pts | −0.6 pts |
Single parents head about one in eight households in Valencia (12.3%), close to the national share of 11.6%.
Single-parent households: households where one adult with no spouse present lives with children under 18. Source: BestNeighborhood calculations from U.S. Census Bureau ACS 5-year block-group estimates (table B11003).
Housing in Valencia
Renters in Valencia
| Period | Valencia | Buckeye | Phoenix area | Arizona | U.S. |
|---|---|---|---|---|---|
| 2006–10 | 28.6% | 24.6% | 32.8% | 32.6% | 33.3% |
| 2010–14 | 39.3% | 31.1% | 37.7% | 36.6% | 35.6% |
| 2015–19 | 36.8% | 23.4% | 36.6% | 35.6% | 36.0% |
| 2020–24 | 26.3% | 13.6% | 33.4% | 32.6% | 34.8% |
| Change | −2.3 pts | −11.0 pts | +0.6 pts | +0.1 pts | +1.5 pts |
Most households in Valencia own their homes; 26.3% rent, below the national share of 34.8%. Locally, though, renters make up a bigger share here than in Buckeye as a whole (13.6%). About three in ten owners (29.5%) have paid off their mortgages, well below the national share of 39.8%. Renting is most common in the southeast and least common in the northeast.
Renters: occupied homes that are rented rather than owned. Source: BestNeighborhood calculations from U.S. Census Bureau ACS 5-year block-group estimates (table B25003).
Vacant homes in Valencia
| Period | Valencia | Buckeye | Phoenix area | Arizona | U.S. |
|---|---|---|---|---|---|
| 2006–10 | 14.4% | 14.3% | 14.1% | 15.2% | 11.4% |
| 2010–14 | 10.8% | 16.9% | 14.1% | 15.3% | 11.4% |
| 2015–19 | 7.6% | 11.3% | 10.8% | 12.5% | 11.1% |
| 2020–24 | 6.6% | 7.2% | 8.4% | 9.6% | 9.6% |
| Change | −7.8 pts | −7.1 pts | −5.6 pts | −5.6 pts | −1.8 pts |
Fewer homes sit empty in Valencia than nationally: 6.6%, against 9.6% for the U.S. The picture is much the same across Buckeye.
Vacant homes: homes with no one living in them, including vacation homes and homes for sale or rent. Source: BestNeighborhood calculations from U.S. Census Bureau ACS 5-year block-group estimates (table B25002).
Age of homes in Valencia
| Period | Valencia | Buckeye | Phoenix area | Arizona | U.S. |
|---|---|---|---|---|---|
| 2006–10 | 1993 | 2003 | 1988 | 1987 | 1974 |
| 2010–14 | 1991 | 2002 | 1989 | 1988 | 1975 |
| 2015–19 | 1995 | 2005 | 1990 | 1989 | 1977 |
| 2020–24 | 1999 | 2010 | 1993 | 1992 | 1980 |
| Change | +6 | +7 | +6 | +5 | +6 |
Much of the housing in Valencia is relatively new: half of its homes were built after 1999, compared with 1980 for the U.S. as a whole. Locally, though, homes here are older than in Buckeye as a whole, where the median home dates to 2010. The newest homes are mostly in the northeast, the oldest in the center.
Age of homes: the year that splits the housing stock into older and newer halves. Source: BestNeighborhood calculations from U.S. Census Bureau ACS 5-year block-group estimates (table B25035).
Rent in Valencia
| Period | Valencia | Buckeye | Phoenix area | Arizona | U.S. |
|---|---|---|---|---|---|
| 2006–10 | $999 | $1,201 | $1,123 | $1,043 | $965 |
| 2010–14 | $964 | $1,216 | $1,158 | $1,078 | $1,040 |
| 2015–19 | $1,074 | $1,331 | $1,342 | $1,227 | $1,213 |
| 2020–24 | $1,543 | $2,148 | $1,927 | $1,736 | $1,571 |
| Change | +$544 | +$946 | +$804 | +$694 | +$606 |
A typical rental in Valencia costs $1,543 a month with utilities, close to the national median of $1,571. Rents here are lower than in Buckeye as a whole ($2,148). Rent takes 27.0% of the typical renter's income, comfortably under the 30% mark often used to define affordable rent. The priciest rents are in the northwest; the most affordable are in the center.
Rent: monthly rent plus the utilities renters pay themselves. Source: BestNeighborhood calculations from U.S. Census Bureau ACS 5-year block-group estimates (table B25064).
Education in Valencia
Bachelor's degrees in Valencia
| Period | Valencia | Buckeye | Phoenix area | Arizona | U.S. |
|---|---|---|---|---|---|
| 2006–10 | 12.4% | 19.2% | 27.8% | 26.3% | 28.4% |
| 2010–14 | 13.3% | 17.8% | 28.5% | 27.0% | 29.6% |
| 2015–19 | 11.5% | 20.7% | 31.1% | 29.3% | 32.1% |
| 2020–24 | 16.2% | 24.6% | 35.0% | 33.3% | 35.6% |
| Change | +3.8 pts | +5.3 pts | +7.3 pts | +7.0 pts | +7.2 pts |
Fewer adults in Valencia have a four-year degree than in the country as a whole: 16.2%, against 35.6% nationally. College graduates are most concentrated in the southeast and least in the center.
Bachelor's degrees: adults 25 and older with a bachelor's degree or higher. Source: BestNeighborhood calculations from U.S. Census Bureau ACS 5-year block-group estimates (table B15003).
High school graduates in Valencia
| Period | Valencia | Buckeye | Phoenix area | Arizona | U.S. |
|---|---|---|---|---|---|
| 2006–10 | 77.8% | 82.5% | 85.0% | 84.6% | 84.9% |
| 2010–14 | 75.8% | 84.7% | 86.0% | 85.5% | 86.1% |
| 2015–19 | 73.9% | 87.3% | 87.2% | 86.8% | 87.7% |
| 2020–24 | 84.8% | 89.8% | 89.5% | 89.1% | 89.3% |
| Change | +7.0 pts | +7.3 pts | +4.4 pts | +4.5 pts | +4.3 pts |
Just over one in seven adults in Valencia never finished high school, more than nationally: 84.8% have a diploma or equivalent, against 89.3% across the U.S.
High school graduates: adults 25 and older with a high school diploma, GED or more. Source: BestNeighborhood calculations from U.S. Census Bureau ACS 5-year block-group estimates (table B15003).
Jobs in Valencia
| Period | Valencia | Buckeye | Phoenix area | Arizona | U.S. |
|---|---|---|---|---|---|
| 2006–10 | 9.9% | 8.0% | 7.2% | 7.8% | 8.1% |
| 2010–14 | 5.0% | 8.6% | 9.3% | 10.2% | 9.4% |
| 2015–19 | 6.1% | 4.8% | 5.3% | 6.0% | 5.6% |
| 2020–24 | 3.7% | 5.6% | 4.8% | 5.3% | 5.4% |
| Change | −6.2 pts | −2.4 pts | −2.4 pts | −2.5 pts | −2.7 pts |
Jobs have been easier to find in Valencia than nationally: unemployment was 3.7%, against 5.4%. Because the Census pools five years of responses (2020–24), these rates smooth over short swings and lag the current job market.
Unemployment: people looking for work as a share of everyone working or looking. Source: BestNeighborhood calculations from U.S. Census Bureau ACS 5-year block-group estimates (table B23025).
Valencia compared with nearby neighborhoods
| Neighborhood | Household size | Median age | Single parents | Renters | Vacant homes | Median year built | Median rent | Bachelor's degree | High school diploma | Unemployment |
|---|---|---|---|---|---|---|---|---|---|---|
| Valencia | 2.97 | 36.5 | 12.3% | 26.3% | 6.6% | 1999 | $1,543 | 16.2% | 84.8% | 3.7% |
| Sundance | 3.27 | 35.5 | 10.4% | 11.7% | 8.0% | 2006 | $2,039 | 18.9% | 89.7% | 3.0% |
| Estrella-Goodyear | 2.52 | 49.8 | 4.8% | 8.5% | 7.1% | 2009 | $2,356 | 41.8% | 96.7% | 1.8% |
| Sierra Montana | 3.36 | 34.7 | 13.5% | 24.3% | 6.5% | 2004 | $2,132 | 33.4% | 96.7% | 5.4% |
| Estrella-Tolleson | 4.01 | 28.5 | 21.8% | 25.8% | 4.9% | 2008 | $2,106 | 13.3% | 78.7% | 4.2% |
| Surprise Farms | 3.45 | 35.3 | 8.7% | 20.9% | 5.6% | 2007 | $2,457 | 32.6% | 98.6% | 3.5% |
| Agua Fria | 3.44 | 33.4 | 27.0% | 31.4% | 6.5% | 1990 | $1,769 | 10.3% | 73.6% | 7.1% |
| Estrella | 3.61 | 32.1 | 22.3% | 34.0% | 5.2% | 1989 | $1,733 | 13.7% | 70.3% | 5.1% |
| Alta Loma | 2.42 | 41.4 | 16.1% | 24.6% | 5.4% | 1991 | $1,729 | 21.1% | 86.6% | 4.7% |
| Maryvale | 3.48 | 29.6 | 25.2% | 47.1% | 7.5% | 1980 | $1,594 | 14.5% | 72.5% | 6.6% |
| Ironwood Terrace | 3.83 | 33.7 | 20.8% | 31.1% | 3.0% | 1974 | $1,661 | 10.8% | 69.9% | 8.2% |
All figures 2020–24.
Neighborhoods with similar populations: Walnut Hills-Dayton, Dayton, OH · Charter Point, Jacksonville, FL · Civano, Tucson, AZ · Cypresswood, Spring, TX · Derita-Statesville, Charlotte, NC · Dogtown, Selinsgrove, PA · Downtown Jacksonville, Jacksonville, FL · Downtown Lowell, Lowell, MA · Dwight, New Haven, CT · East Dedham, Dedham, MA
About these numbers
Every figure on this page is a BestNeighborhood calculation from the Census Bureau's American Community Survey (ACS), built up from the Census block groups that make up Valencia. Each ACS 5-year release pools five years of responses; this page shows the last 15 releases, 2006–10 through 2020–24. Neighboring releases share four of their five years, so they move gradually and small changes between them are within the survey's margin of error; in small places the lines can jump from one release to the next for the same reason. The maps show the same measures for each neighborhood, ranked against the whole country.
No other site shows detail at this level for free. We are able to keep this site free by receiving a small commission from the referring links on this page. Please share or cite this page if you aren’t able to otherwise support our work.