South Hanlon, TX Housing Data

This page shows a collection of maps for visualizing South Hanlon, TX housing data.

South Hanlon, TX Home Owners and Renters Map

In South Hanlon, 12.80% of people rent their homes or live in apartments. Additionally, 73.94% own their homes free and clear. This map shows which areas are primarily occupied by owners and renters in South Hanlon. See the key below. Areas in grey have 0% owner occupation, which sometimes means there are no homes in the area.
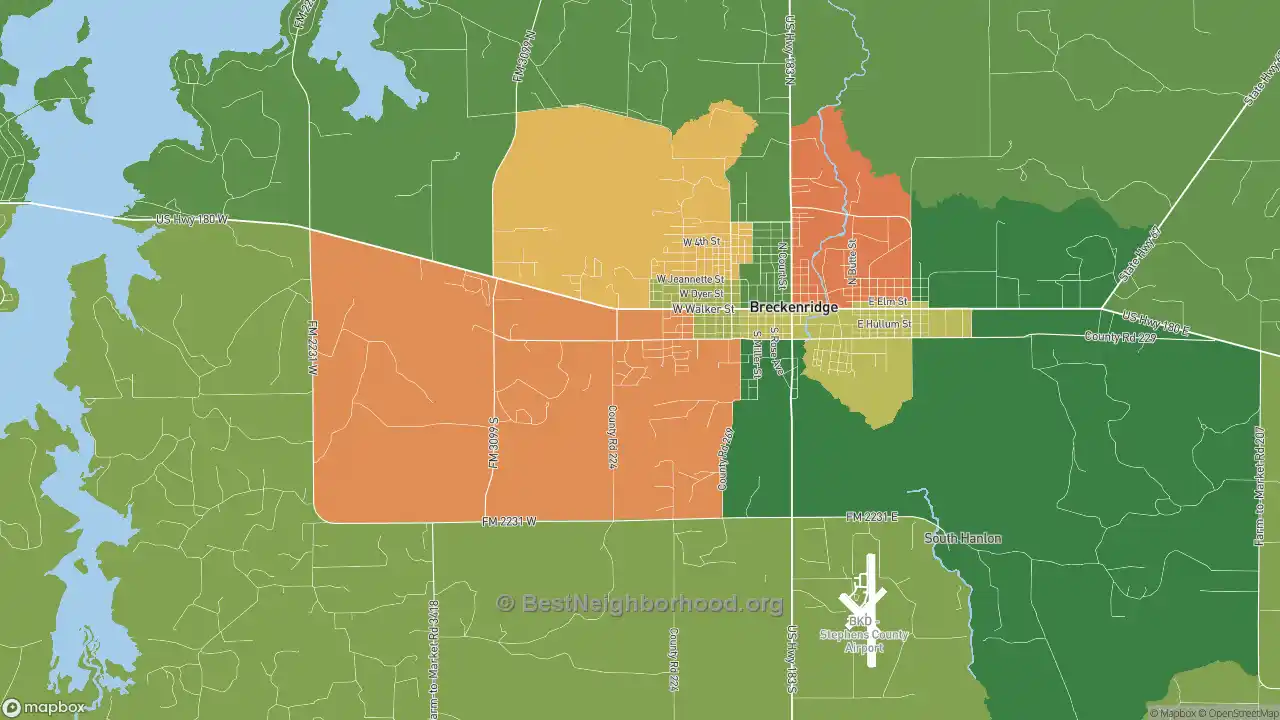
 

South Hanlon, TX Map of Owner vs. Renter Occupied Neighborhoods
Click the map to explore

Owners vs. Renters Key

Mostly Owner Occupied
Owners and Renters
Mostly Renter Occupied

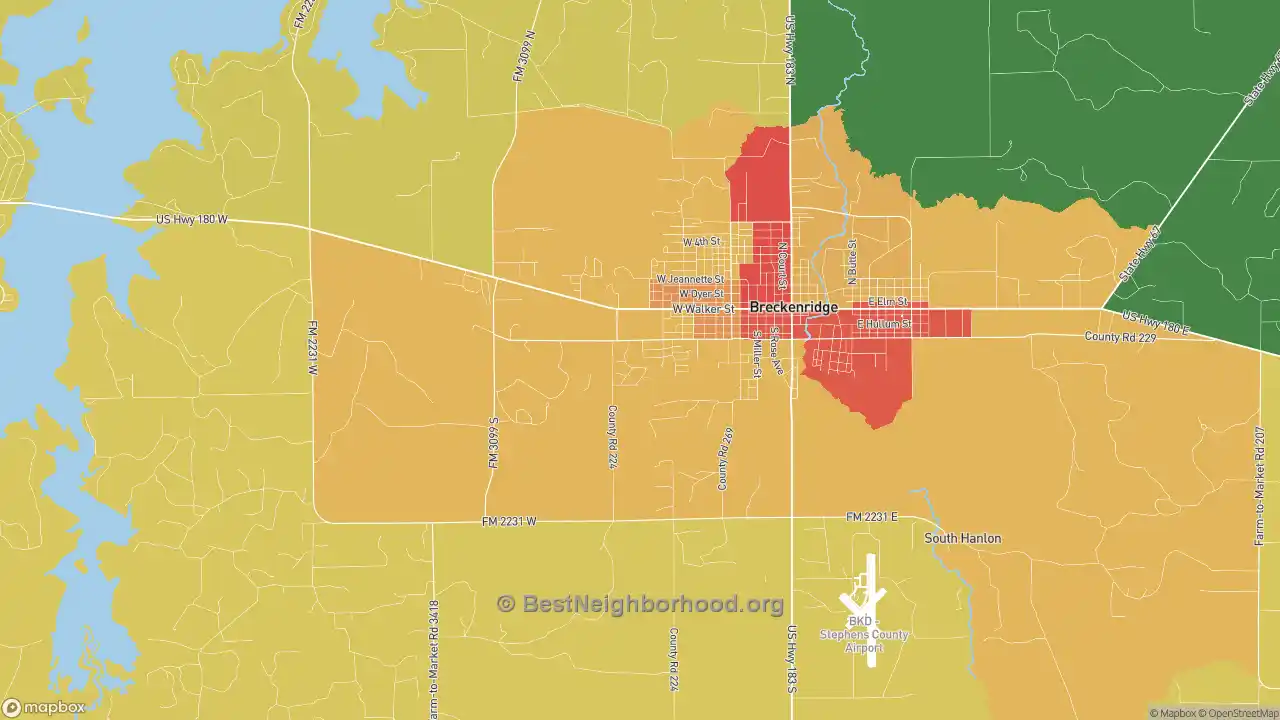
South Hanlon, TX Home Vacancy Rates Map

The average vacancy rate in South Hanlon is 27.59%. This map shows vacancy rates by block in the city. Most home buyers want to avoid vacancies. Not only are vacant properties targets for squatters, but it tends to diminish home values over time. South Hanlon areas with high vacancy rates are shown in red, low vacancy rates in green, and high but manageable vacancies in yellow.


South Hanlon, TX Map of Vacant Houses and Vacancy Rates
Click the map to explore

Vacancy Rate Key

Low Vacancy
Moderate Vacancy
High Vacancy

South Hanlon, TX House Age Map

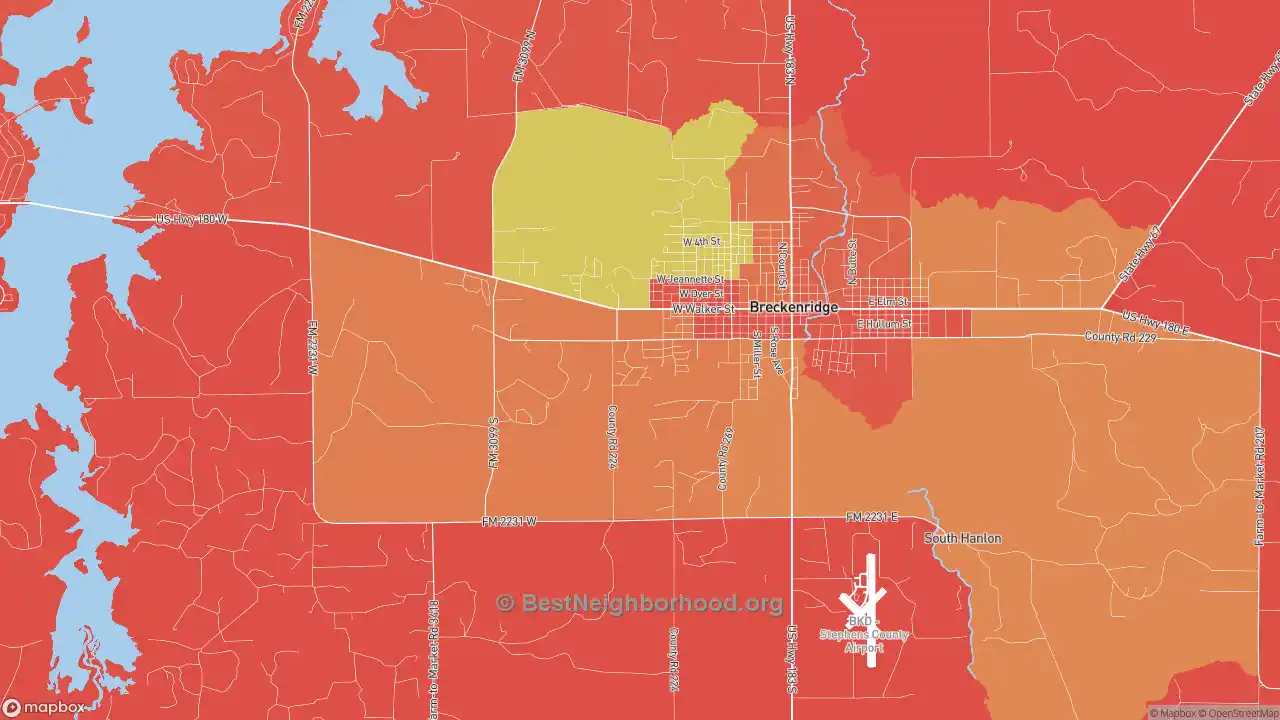
The average home in South Hanlon was built in 1974. This map shows the average home age by block or county. People looking for newer or older neighborhoods can use the map to see the average age of homes in neighborhoods in South Hanlon. Areas in green have homes that are, on average, 15 years old or newer. Areas in the darkest red shades have homes that are, on average, 80 years old or older.


South Hanlon, TX Map of Old and New Home Neighborhoods by Year Built
Click the map to explore

Home Age Key

New Homes
Average Aged Homes
Older Homes

Home Services

No other site shows detail at this level for free. We are able to keep this site free by receiving a small commission from the referring links on this page. Please share or cite this page if you aren't able to otherwise support our work. Note that big changes are coming to this page in particular to add much more detail.

Updated 2023 using the most recent data available (2021)