
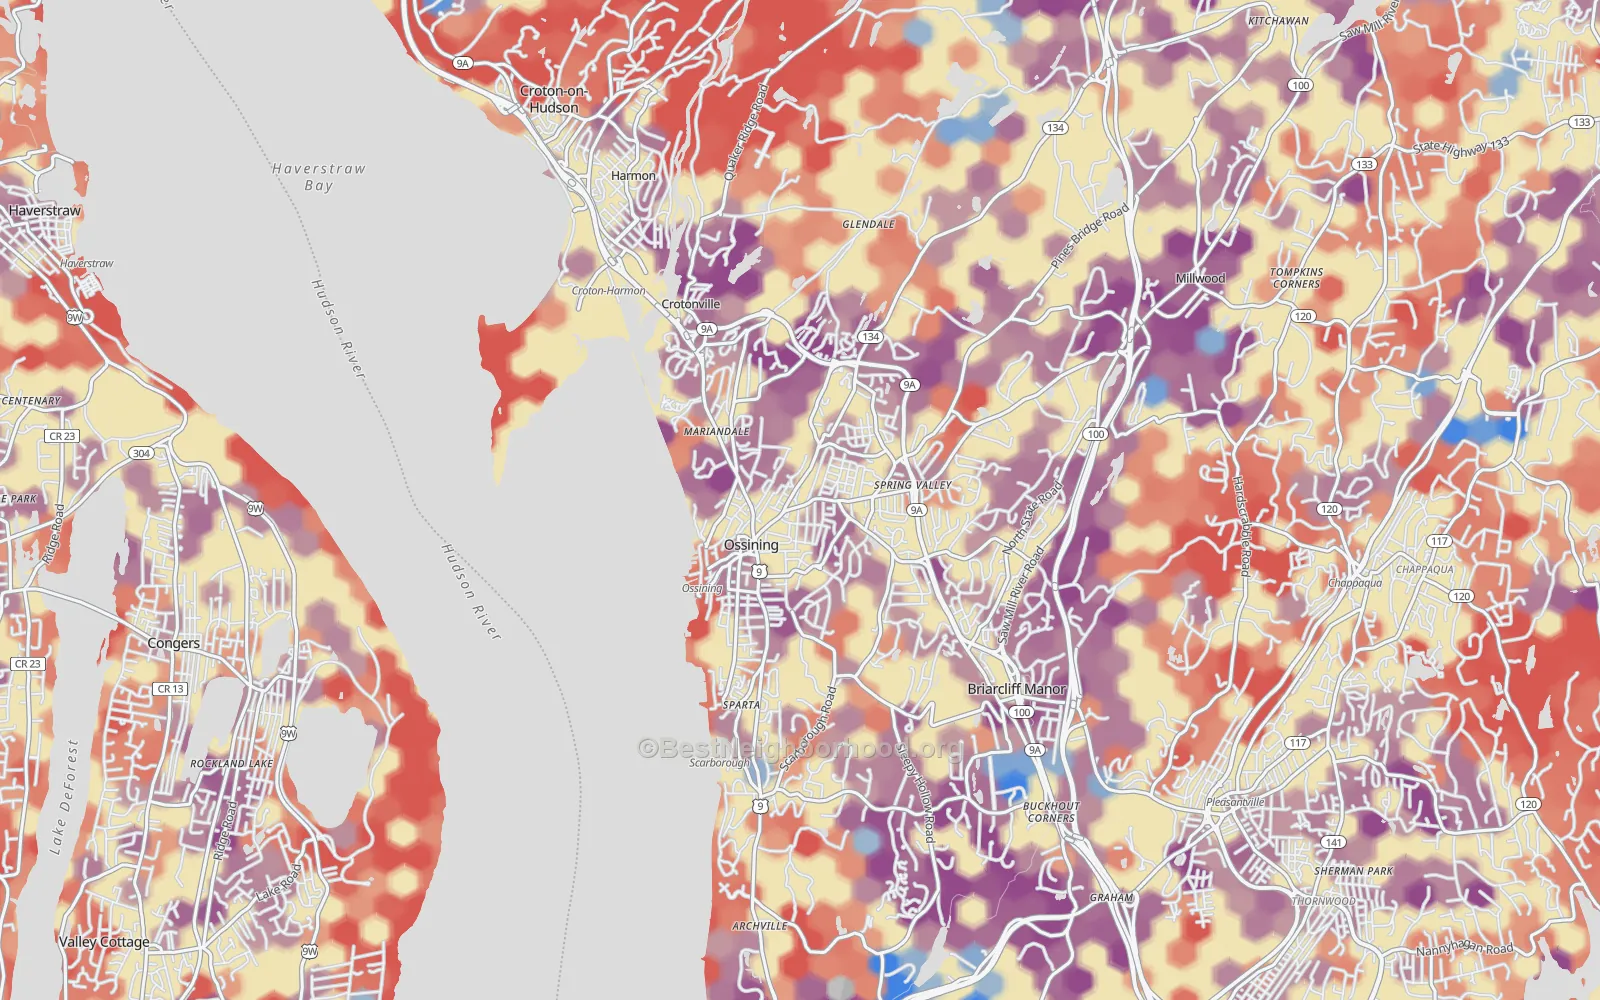
Best Cell Phone Coverage in Ossining, NY
T-Mobile and Verizon are close in Ossining, with T-Mobile ahead at 79 out of 100 against 76. A strong signal reaches 96% of residents on Verizon and 93% on T-Mobile.
to rank the networks at your home, your work and the other places you go.
T-Mobile network
Strong signal for 93% of Ossining residents

BestNeighborhood may earn a commission from these links.
Verizon network
Strong signal for 96% of Ossining residents

BestNeighborhood may earn a commission from these links.
AT&T network
Strong signal for 73% of Ossining residents

BestNeighborhood may earn a commission from these links.
This page is for anyone choosing a cell carrier in Ossining on coverage. Beside the ranking of T-Mobile, Verizon and AT&T, it shows the strongest network in each part of Ossining, results on the main roads, the signal at 2 places people go and cheaper plans on the same networks. Add your own places to My places and the ranking sorts by the signal at them.

BestNeighborhood may earn a commission from some of the brands listed. Rankings come from the coverage data alone.
Source: FCC National Broadband Map, mobile coverage as of June 30, 2026.
Top cell phone providers in Ossining at a glance
The networks score 79 for T-Mobile, 76 for Verizon and 68 for AT&T in Ossining. T-Mobile has the clearly best signal where 46% of residents live. Verizon leads where 9% of residents live. AT&T is the clear leader almost nowhere in Ossining.
Signal scores run from 0 to 100, and excellent, good, fair and weak describe them from the top down. A strong signal is a score in the good or excellent range. Across New York State the best network scores 83; Ossining is 4 points below that at 79. Among the 488 New York cities with 5,000 or more residents, Ossining ranks 211th for its best signal.
| Network and brands | Signal score | Residents with a strong signal | Land with service | Clearly best for |
|---|---|---|---|---|
| T-Mobile: Mint Mobile, Bark, Boost Mobile and T-Mobile | 79 Good | 93% | 95% | 46% of residents |
| Verizon: Visible and Verizon | 76 Good | 96% | over 99% | 9% of residents |
| AT&T: Cricket Wireless and AT&T | 68 Good | 73% | over 99% | Almost none |
Where the top two networks are within a few points of each other, the map calls the spot too close to call. That covers 45% of residents.
Mint Mobile sells plans on it from $15/mo.
BestNeighborhood may earn a commission from these links.
Which provider is best, by part of Ossining
Of the 7 parts shown, T-Mobile is best in 4, and 3 are too close to call. Rows start at the center and run clockwise from the north. Each row is one part of a nine-part grid around where people live, scored from the hexagons its residents live in.
- Central Ossining T-Mobile 85, Verizon 80, AT&T 71. T-Mobile network
- Northeastern Ossining T-Mobile 77, Verizon 73, AT&T 67. Too close to call
- Eastern Ossining T-Mobile 75, Verizon 75, AT&T 62. Too close to call
- Southern Ossining T-Mobile 88, Verizon 83, AT&T 76. T-Mobile network
- Southwestern Ossining T-Mobile 74, Verizon 73, AT&T 65. Too close to call
- Western Ossining T-Mobile 78, Verizon 71, AT&T 66. T-Mobile network
- Northwestern Ossining T-Mobile 75, Verizon 69, AT&T 58. T-Mobile network
The strongest signal is in southern Ossining, 88 from T-Mobile; the weakest is in southwestern Ossining, 74 from T-Mobile.
Mint Mobile sells plans on it from $15/mo.
BestNeighborhood may earn a commission from these links.
Cell service on the road in Ossining
Each network's figure is how much of a main road in Ossining keeps service in a moving car, by the FCC's in-car test. The biggest gap is on Taconic State Pkwy: T-Mobile holds in a car on 59% of it, against over 99% for AT&T.
| Road | T-Mobile | Verizon | AT&T |
|---|---|---|---|
| Taconic State Pkwy | 59% | 86% | over 99% |
| Croton Ave | over 99% | over 99% | over 99% |
Cricket Wireless sells plans on it from $35/mo.
BestNeighborhood may earn a commission from these links.
Cell signal at the places people go in Ossining
The table gives each network's signal score at the high school and the hospital in Ossining, read at each spot from the same hexagons as the map. The widest gap is at Phelps Memorial Hospital Center: 77 for T-Mobile against 61 for AT&T.
| Place | T-Mobile | Verizon | AT&T |
|---|---|---|---|
| Ossining High School | 88 Excellent | 86 Excellent | 74 Good |
| Phelps Memorial Hospital Center | 77 Good | 75 Good | 61 Good |
Cheap cell phone plans in Ossining, by network
Brands that sell plans on a network use its towers, so they get that network's signal score here: T-Mobile 79, Verizon 76 and AT&T 68.
| Brand | Network | Plans from | Plans |
|---|---|---|---|
| T-Mobile network signal score 79 (Good) in Ossining | |||
| Mint Mobile | T-Mobile | $15/mo | See Mint Mobile plans |
| Bark (phones for kids) | T-Mobile | $29/mo | See Bark plans |
| Boost Mobile | T-Mobile | $35/mo | See Boost Mobile plans |
| T-Mobile | T-Mobile | See site | See T-Mobile plans |
| Verizon network signal score 76 (Good) in Ossining | |||
| Visible | Verizon | $35/mo | See Visible plans |
| Verizon Wireless | Verizon | See site | See Verizon plans |
| AT&T network signal score 68 (Good) in Ossining | |||
| Cricket Wireless | AT&T | $35/mo | See Cricket Wireless plans |
| AT&T Wireless | AT&T | See site | See AT&T plans |
BestNeighborhood may earn a commission from these links. Rankings come from the coverage data alone.
5G coverage in Ossining
5G reaches nearly everyone in Ossining on every network, so the signal score is what tells them apart. Share of residents with 5G from each network: AT&T over 99%, Verizon 99% and T-Mobile 96%.
Questions about cell service in Ossining
Is T-Mobile or Verizon better in Ossining?
T-Mobile scores 79 out of 100 in Ossining and Verizon 76. T-Mobile has the clearly best signal where 46% of residents live, Verizon where 9% live. Verizon files service on more of the land, over 99% against 95%.
Do Mint Mobile, Visible and Cricket Wireless get the same coverage in Ossining?
Yes. Each sells plans on a national network and uses its towers, so each gets that network's signal. In Ossining, Mint Mobile uses T-Mobile's network (79 here), Visible uses Verizon's network (76 here) and Cricket Wireless uses AT&T's network (68 here). Some of their plans get lower priority when a tower is busy, but where the signal reaches is the network's.
How many cell phone providers serve Ossining?
Three networks file coverage in Ossining with the FCC: T-Mobile, Verizon and AT&T. Brands such as Mint Mobile, Visible and Cricket Wireless sell plans on those networks.
Which carrier covers the most land around Ossining?
Verizon and AT&T file service on over 99% of the land in Ossining, against 95% for T-Mobile. That matters on back roads and outdoors more than in town, where each of them reaches most homes.
How can I get better cell reception at home in Ossining?
The scores here describe the signal outdoors, and walls cut it, so check the map at your own address first. In Ossining, T-Mobile gives a strong signal to 93% of residents and Verizon to 96%. If your network is weak where you live, a network that is strong there, or Wi-Fi calling, which T-Mobile, Verizon and AT&T all offer, usually helps more than a new phone.
How accurate is this coverage map of Ossining?
The scores for Ossining come from 389 hexagons of about 26 acres each, using the coverage each carrier files with the FCC. The carriers model that coverage; it is not a speed test, and it describes the signal outdoors. Each carrier runs its own model, so a gap of a few points can come from how they model it.
How the scores are made
Each signal score describes the cell signal outdoors in one hexagon of about 26 acres, from the coverage each carrier models and files with the Federal Communications Commission (FCC). The FCC sets the speed tiers and the moving-car test the same way for every carrier; each carrier models its own signal. A place's score averages its hexagons by the time people spend in each one: at home, at work, at school and on the road. Shares of residents count where people live. It is a coverage estimate, not a speed test, and signal indoors is weaker.
How the signal score is made, and its limits
Sources
Federal Communications Commission, National Broadband Map: mobile coverage as of June 30, 2026 (published November 10, 2026): the signal scores, 5G and the moving-car coverage
U.S. Census Bureau: 2020 census residents in each hexagon; the American Community Survey and LEHD commuting data behind the time people spend in each one
Federal Highway Administration, Highway Performance Monitoring System: the main roads and their traffic
National Center for Education Statistics: colleges and public high schools
Federal Aviation Administration: commercial airports
Overture Maps Foundation: hospitals and stadiums
BestNeighborhood may earn a commission from some of the brands listed. Rankings come from the coverage data alone.
By the BestNeighborhood data science team. Last updated November 2026.
Networks ranked by signal score in Ossining
- #1T-Mobile network, Mint Mobile plans from $15/mo: 79 Good. See Mint Mobile plans
- #2Verizon network, Verizon Wireless plans: 76 Good. See Verizon plans
- #3AT&T network, Cricket Wireless plans from $35/mo: 68 Good. See Cricket Wireless plans
Mobile service in places near Ossining
More on Ossining: Internet providers · Best neighborhoods · Walk Grade · Noise · Demographics · Household income · Community health