
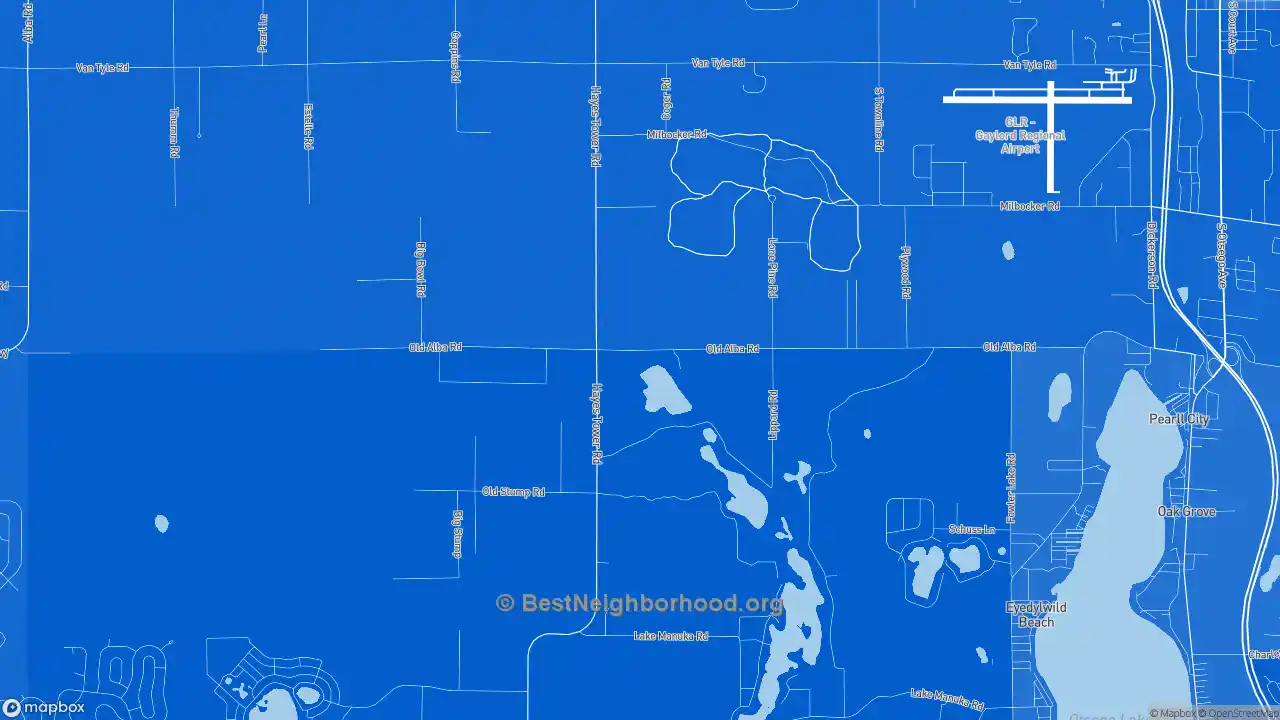
The map below shows majority race by area in Eyedylwild Beach, as self-identified on the US census. Darker shades indicate a larger racial majority in that neighborhood. This page also contains data and maps on Eyedylwild Beach racial diversity and diversity scores. Click here to scroll to diversity data.
WhiteHispanicBlackAsianMultiple/Other
Majority race by area
The majority race in Eyedylwild Beach overall is white, making up 93.3% of residents. The next most-common racial group is other at 3.0%. There are more white people in the east areas of the city. People who identify as other are most likely to be living in the north places. The data below shows how many people identify themselves as each of the following races, which most Americans base on their family's national origin:
Race in Eyedylwild Beach
Self-Identified Race |
Eyedylwild Beach, MI Population |
|---|---|
White |
93.3% |
Hispanic |
2.8% |
Black |
0.5% |
Asian |
0.5% |
Native American |
0.0% |
Other |
3.0% |
Diversity and Diversity Scores for Eyedylwild Beach, MI
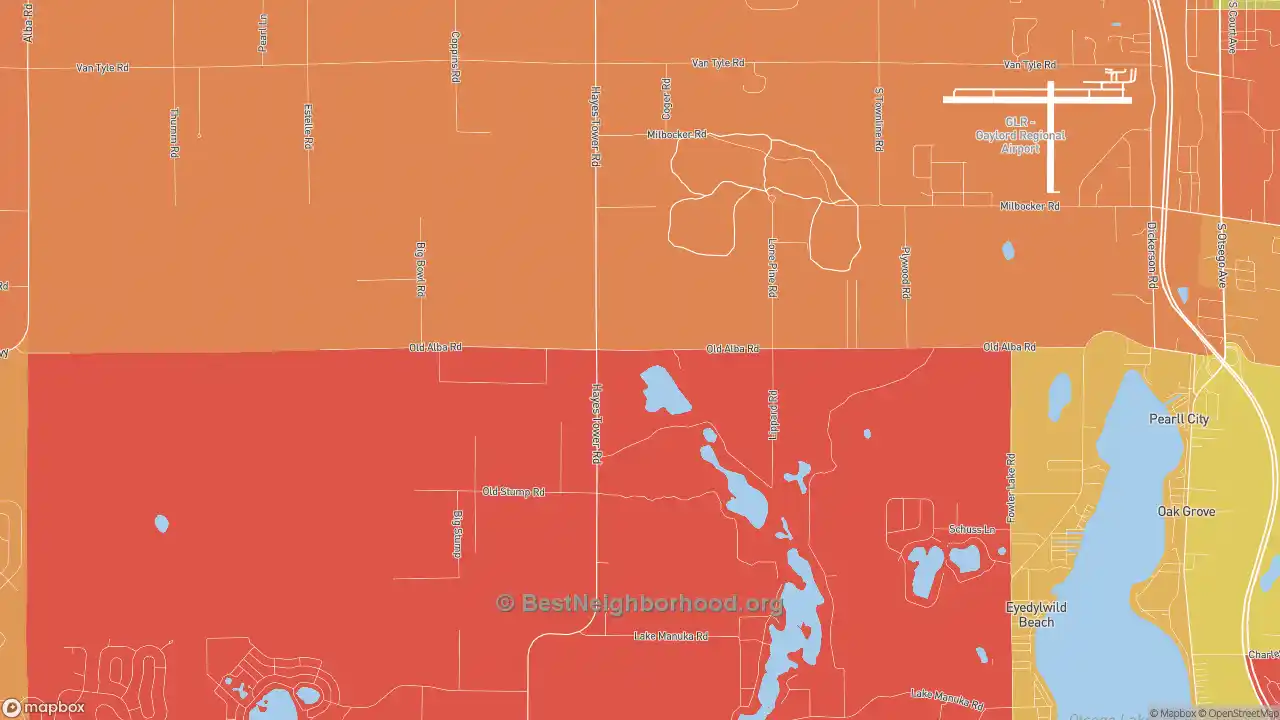
The map below shows diversity in Eyedylwild Beach. Areas in green are more diverse, while areas in red are much less diverse. Diversity, in this case, means a mixture of people with different race and ethnicity living close to one another. For example, all-black and all-white areas in the city would both be considered lacking diversity.
Less diverse
More diverse
Colorblind friendly
off
Eyedylwild Beach Diversity Score
12.8
More diverse than 27% of US cities
Eyedylwild Beach has a diversity score of 12.8: the chance, in percent, that two residents picked at random belong to different racial or ethnic groups, from ACS race counts. A place where everyone shares one group scores 0, and an even mix of the six groups in the chart above scores the maximum, 83.3. Eyedylwild Beach is less diverse than other US cities, more diverse than 27% of them. Within Eyedylwild Beach's proper boundaries, the most diverse area is northwest Eyedylwild Beach, and the least diverse areas are in east Eyedylwild Beach.
Source: BestNeighborhood calculations from the U.S. Census Bureau, American Community Survey (ACS) 2020-2024 5-year estimates (race and Hispanic origin); proprietary data mapping and analysis. Special thanks to the University of Virginia.