
Put this Walk Grade on your own site with the free Walk Grade widget.
95116 earns a Walk Grade of B- with a score of 48 out of 100. Walk Grade measures whether a person could handle daily life walking without a car, and whether a reasonable person would find the walk pleasant or stressful. It traces the real route to the places people need to go: grocery stores, schools, parks, and more. The grade accounts for things like stressful roads that have to be crossed, traffic noise, how much shade there is, and much more. About 21% of residents live in walkable areas, 28% live in car-dependent areas, and 51% live where life without a car is harder but possible.
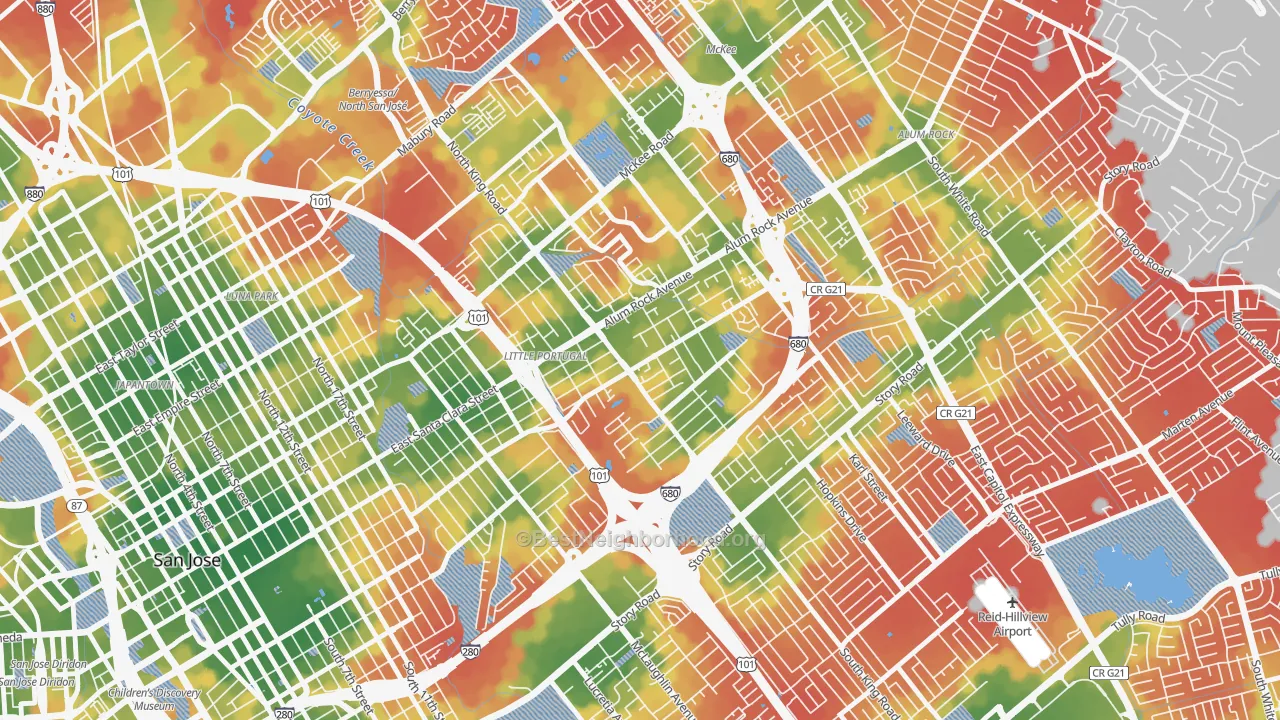
Walk Grade map of 95116, CA
Greener blocks are more walkable; red blocks are car-dependent. Areas in grey score near zero and are left unshaded. Sharp edges along freeways and wide arterials are real, because those roads cut the walking network.
The risk of walking in 95116
Federal crash records show 95116 recorded 27 pedestrian deaths over the last ten years, about 2.7 a year. Measured against the residents most exposed, the 570 people who walk or take transit to work, that is 47.4 deaths per 10,000 walk-and-transit commuters each year. That rate is higher than the typical US ZIP code.
Here is how that rate compares with 95116, CA, similar-size places, and the national average.
What the walk is actually like in 95116
Most walk scores stop at distance: how far is the store. Walk Grade also reads what the walk is like along the way. Three of those inputs are easy to compare against the rest of the country.
95116 streets carry about 4% tree cover where people walk, below the typical US ZIP code (12%).
Residents live among about 386 street intersections per square mile, above the typical US ZIP code.
Loud, fast arterials make up about 9.0% of the area's main roads, above most US ZIP code areas.
Share of 95116 residents at each Walk Grade level
Every block is graded, then residents are sorted by the grade where they live. 21% live in areas graded B-plus or higher; 28% live in areas graded D or lower.
Walk Grade by part of 95116
The most walkable part of the ZIP code is southeastern 95116, with a Walk Grade of 66. The least walkable is southern 95116, at 24, a gap of 42 points. Within any one direction, two blocks can still differ sharply depending on the streets and crossings between them.
Southeastern 95116
Western 95116
Southwestern 95116
Eastern 95116
Southern 95116
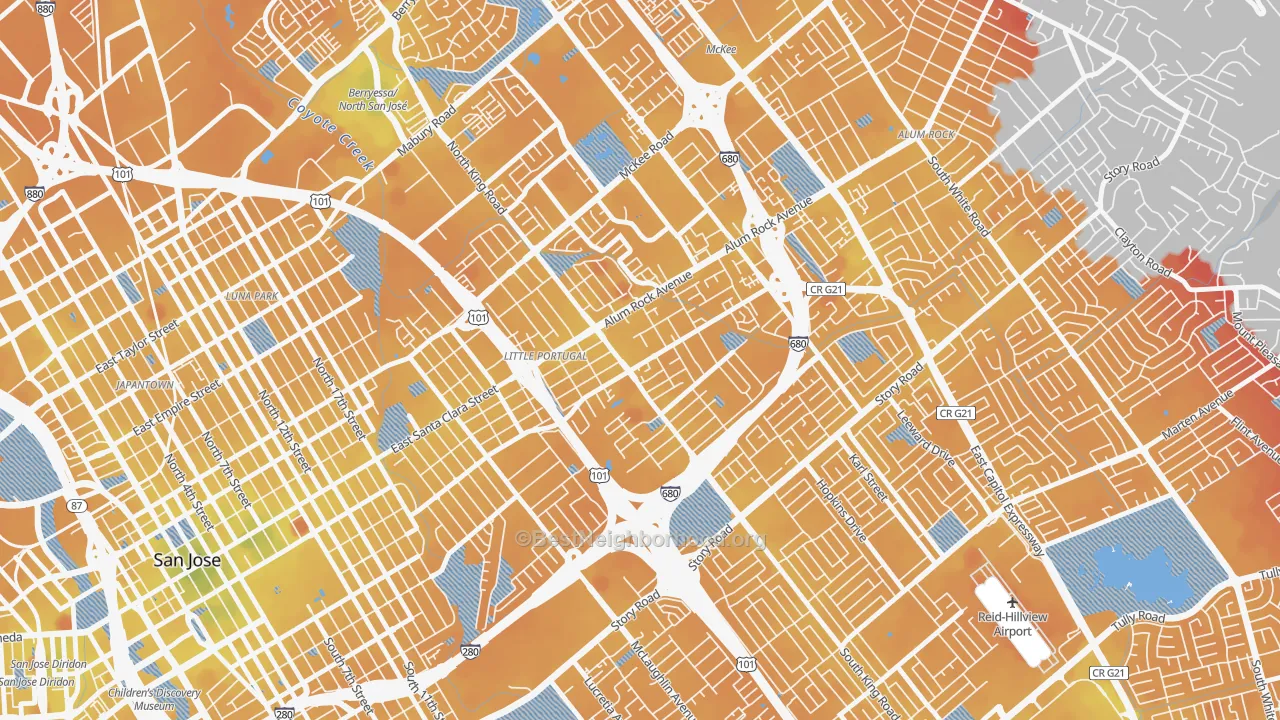
Transit Grade map of 95116, CA
Transit Grade asks whether a person could live here without a car. It scores the service at the front door in minutes, the walk to the nearest stop plus the wait for the next bus or train, then adds where those lines can take a rider. At a Transit Grade of 32 out of 100, 95116 sits above most US ZIP code areas for car-free access.
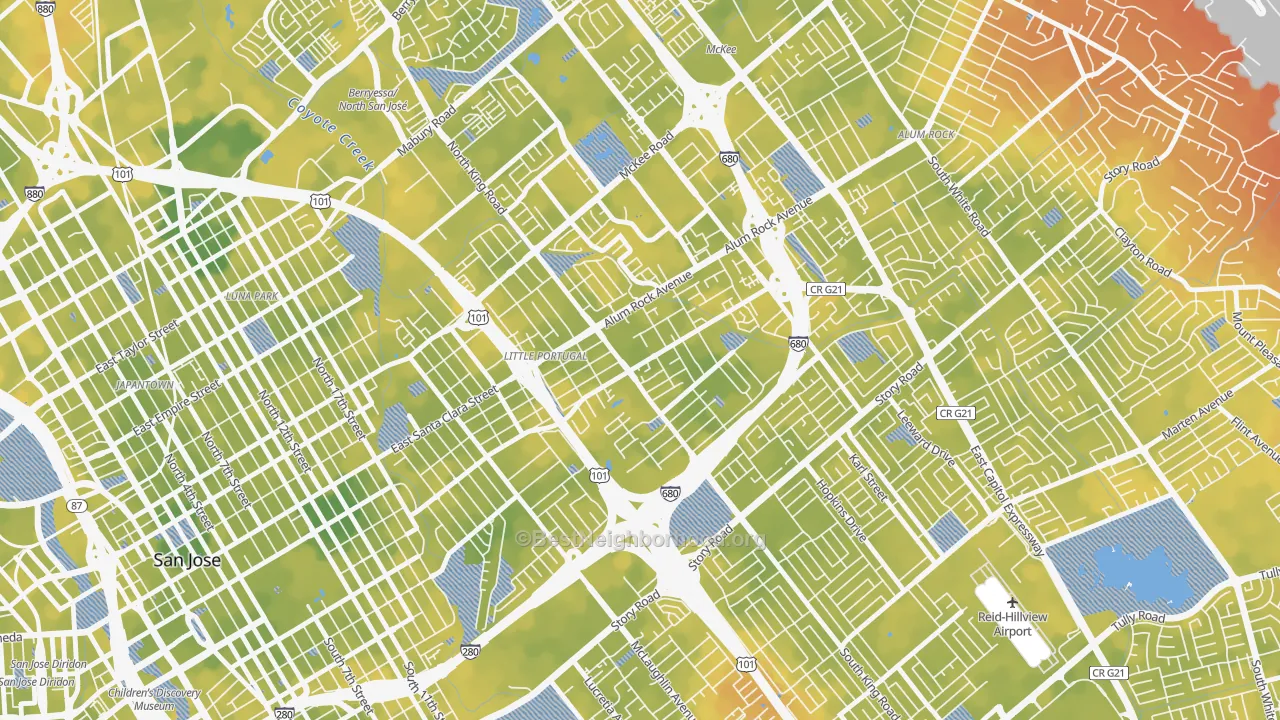
Bike Grade map of 95116, CA
Bike Grade asks whether a bike could replace a car. It weighs protected bike lanes, hills, destinations within a longer bike range, and links to transit, and it rewards places where the ride stays on calm, low-traffic streets. Its Bike Grade of 63 reflects the bike network, the hills, and how much of the ride sits on calm, low-traffic streets.
95116 next to similar places
Compared with zip areas of a similar size, here is how 95116 scores for walkability.
Why this reads lower than distance-only scores
A score that measures straight-line distance can call a place walkable when a store sits 200 meters away across a freeway. Walk Grade measures the real route to that store, so the freeway detour, the arterial crossings, and the missing sidewalks all count. The number is lower, and it matches the walk a person would actually take. The full method, including the destination model and every route penalty, is documented on the Walk Grade methodology page.
Neighborhood crime is folded in as a small adjustment, from BestNeighborhood's CrimeGrade data, including theft for the bike score.
Sources
- Overture Maps Foundation. Three layers: Places (the destinations), Transportation (every street, footpath, sidewalk, crossing, and driveway in the routing graph), and Buildings (footprints used to estimate store size and to filter out home-based businesses registered at a house).
- Highway Performance Monitoring System (HPMS), U.S. Federal Highway Administration. Traffic volume, speed, and lane counts behind the modeled road-noise surface that drives the crossing and walk-along-a-stroad penalties. Processed through the BestNeighborhood road-noise model.
- National Land Cover Database, Tree Canopy Cover, U.S. Geological Survey and the MRLC Consortium. Satellite tree-canopy percentage sampled along each road segment for the shade term.
- USGS 3D Elevation Program (3DEP). Elevation used to compute street grade for the Bike Grade hill term.
- National GTFS transit feeds. Full published schedules (routes, trips, frequencies) for the Transit Grade.
- OpenStreetMap (via Geofabrik). On-street bike-lane tagging that supplements the Overture network for the Bike Grade.
- Census LEHD LODES, U.S. Census Bureau. Jobs by workplace, used to weight where transit can take you.
- Census TIGER/Line geography and block population, U.S. Census Bureau. Block and block-group boundaries and resident counts used to roll hex grades up to neighborhoods, cities, zip codes, metros, counties, and states.
- American Community Survey 5-year estimates, U.S. Census Bureau. Commute-mode shares (walk, bike, transit) used for the Bike Grade and for the pedestrian-death research above.
- Kontur Population and LandScan. Population density used to set the metro extent and normalize the score.
- Google Places. A selective backfill that classifies a small set of food stores Overture leaves uncategorized. Overture remains the primary source of destinations.
- Fatality Analysis Reporting System (FARS), U.S. National Highway Traffic Safety Administration. Pedestrian and cyclist traffic deaths used in the safety research. Not an input to the Walk Grade map.
- CrimeGrade. Neighborhood crime percentiles used for the small safety nudge.
- PeopleForBikes Bicycle Network Analysis and the Furth-Mekuria Level-of-Traffic-Stress framework it builds on. Inspiration for the Bike Grade traffic-stress gate, adapted to our data, not copied.
Method reviewed by the BestNeighborhood data science team. Last updated August 2026.