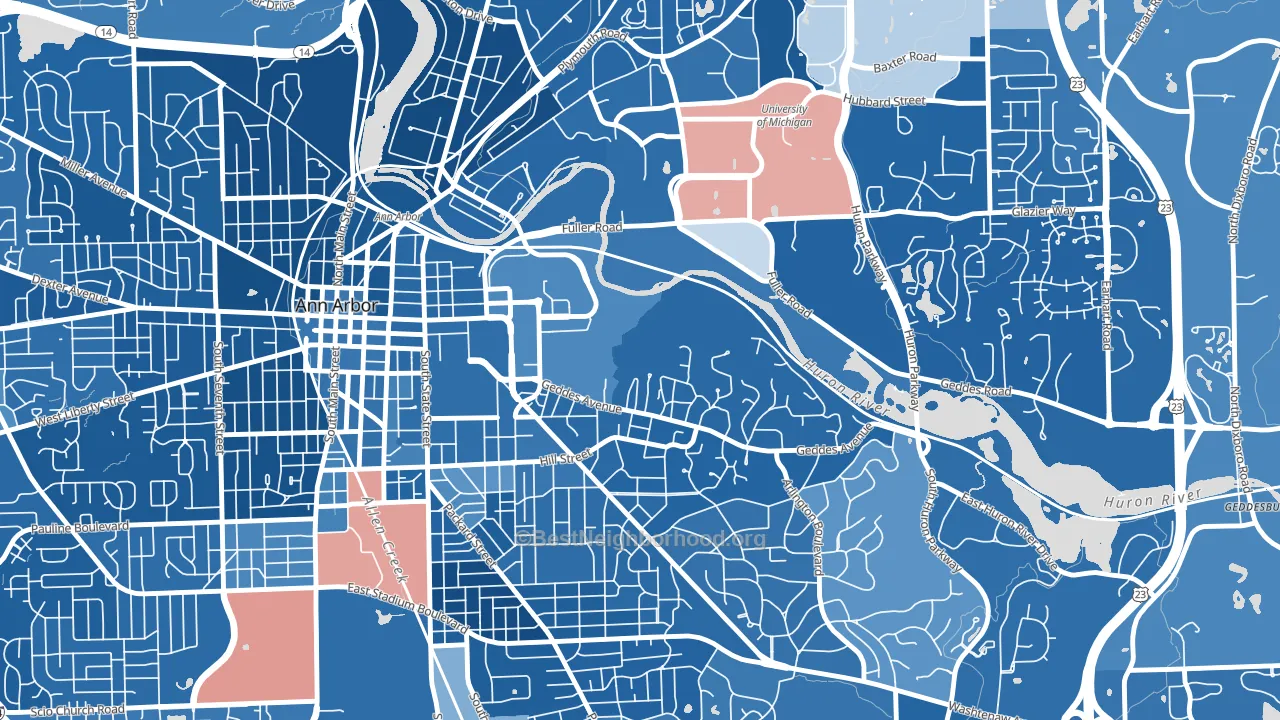
Angells is a Democratic stronghold. About 85% of voters here vote Democratic and 15% Republican.
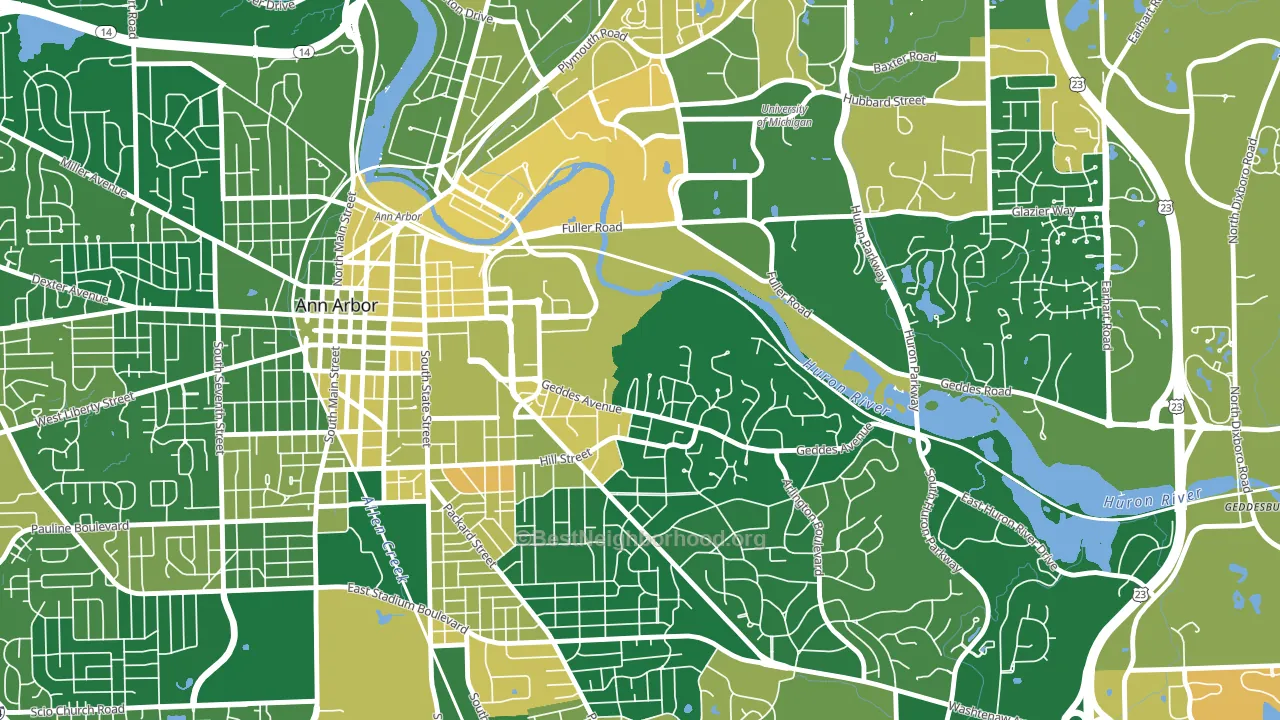
About 80% of adults in Angells typically vote, above the U.S. average of about 62%. Among adults in Angells, ~68% vote Democratic, ~12% Republican, and ~20% don't vote. The map below shows estimated turnout by block group.
How Angells compares
Among neighborhoods within 5 miles, Angells leans more Democratic than 10 of 15 neighbors.
Angells runs about 70 points more Democratic than Michigan as a whole. Michigan is roughly evenly split, and Angells sits clearly on the Democratic side.
Politics vary noticeably by block within Angells. The east side is the most Democratic-leaning (D+81) and the northeast side is the least Democratic-leaning (D+57), a spread of about 24 points.
Why Angells leans the way it does
This analysis examined 14,881 data points per neighborhood to find what predicts political lean and turnout. The items below are a few correlations that stood out for Angells, not a ranked or complete list of what matters most.
Areas with high college attainment vote Democratic. About 70% of adults in Angells hold a bachelor's degree, about 42 points above the U.S. average of 28%. A high never-married share predicts Democratic voting, and about 71% of adults in Angells have never been married, above 98% of neighborhoods. Angells runs against the grain of Michigan, a Democratic-leaning outlier in a roughly evenly split state.
Park access and Democratic lean
Places with heavy park coverage tend to lean Democratic; Angells, Ann Arbor, MI sits in the top quarter nationally on this measure. Park access does not change how people vote; it tends to track denser, higher-income areas.
Why turnout in Angells looks the way it does
Areas with high high-school completion turn out at higher rates. More than 99% of adults in Angells have completed high school, about 8 points above the Michigan average of 92%. Learn more about the findings and methodology on the political spectrum map.
Nearby Neighborhoods
- Burns Park, Ann Arbor, MI D+69
- Bach, Ann Arbor, MI D+72
- Northside Ann Arbor, Ann Arbor, MI D+73
- King, Ann Arbor, MI D+58
- Eberwhite, Ann Arbor, MI D+79
- Wildwood, Ann Arbor, MI D+78
- Bryant Pattengill East, Ann Arbor, MI D+64
- Logan, Ann Arbor, MI D+62
- Thurston, Ann Arbor, MI D+66
- Dicken, Ann Arbor, MI D+71
Neighborhoods with Similar Populations
- Grant Beach, Springfield, MO Even
- Nearnorthwest, South Bend, IN D+48
- Sycamore Manor, Sycamore, IL D+14
- Downtown Akron, Akron, OH D+62
- Hillwood Estates, Nashville, TN D+5
- Mills Estates, Burlingame, CA D+43
- Dahlman, Omaha, NE D+38
- South Side, Sandusky, OH D+20
- Arena District, San Antonio, TX D+44
- West Downtown Dearborn, Dearborn, MI D+8
Sources and methodology
Precinct-level voting records used to fit the model come from Michigan Department of State, Elections, distributed by the Voting and Election Science Team. Demographic inputs come from the U.S. Census Bureau (ACS 5-year estimates and the 2020 Decennial Census). Health and environmental inputs come from the CDC (PLACES and the Environmental Justice Index). Land cover comes from the USGS and EPA. Election-day and lead-up weather come from PRISM 4km daily grids and the NOAA Global Historical Climatology Network. Mail-voting and election-administration patterns come from the MIT Election Lab's Survey of the Performance of American Elections. Block-group crime detail comes from CrimeGrade. Internet data and modeling support provided by ISPreports.org.
Modeling and analysis by the BestNeighborhood data science team. Full methodology and findings: political spectrum map.
Methodology reviewed by the BestNeighborhood data team. Last updated May 2026.