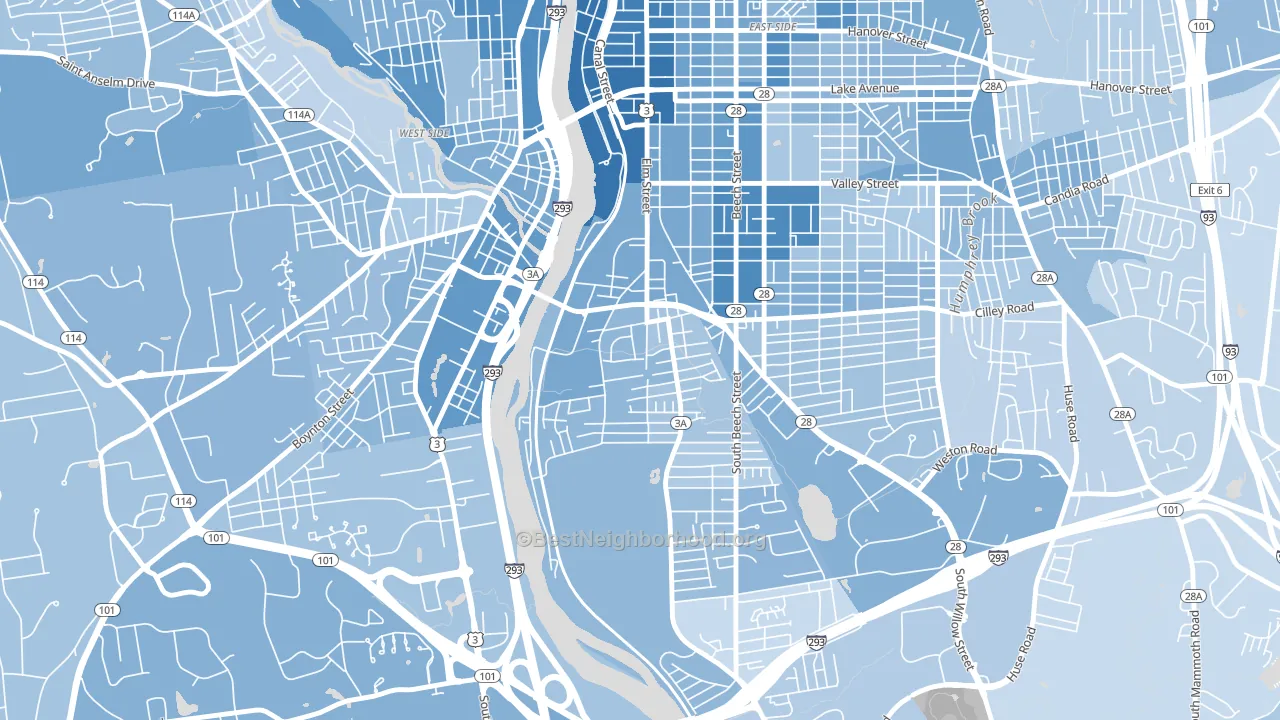
Bakersville leans Democratic by roughly 20 points: about 60% of voters vote Democratic and 40% Republican. These figures are model estimates: New Hampshire did not have precinct-level voting records available for training, so the numbers above come from demographic and health features rather than local ground truth.
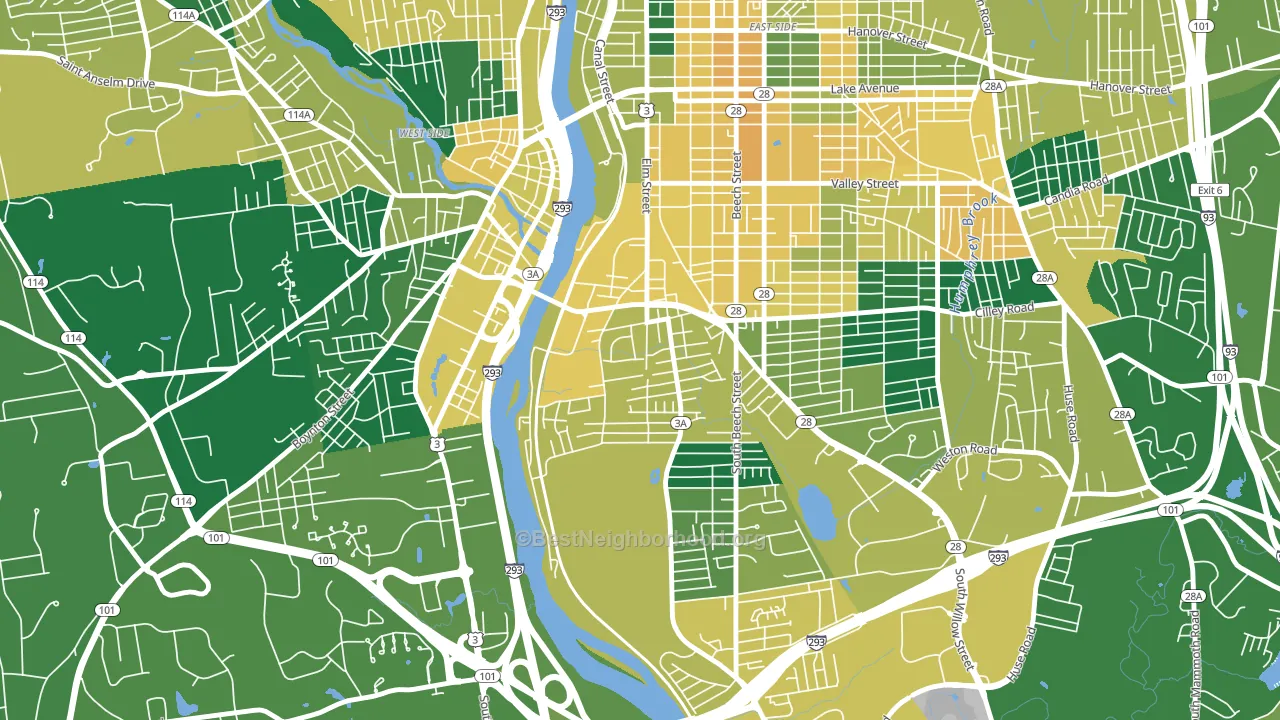
About 55% of adults in Bakersville typically vote, below the U.S. average of about 62%. Among adults in Bakersville, ~33% vote Democratic, ~22% Republican, and ~45% don't vote. The map below shows estimated turnout by block group.
How Bakersville compares
Among neighborhoods within 5 miles, Bakersville leans more Democratic than 3 of 12 neighbors.
Bakersville runs about 18 points more Democratic than New Hampshire as a whole.
Politics vary noticeably by block within Bakersville. The north side is the most Democratic-leaning (D+49) and the west side is the least Democratic-leaning (D+11), a spread of about 37 points.
Why Bakersville leans the way it does
Density, race composition, education, and family structure all sit close to their national averages in Bakersville. None of them point strongly toward either party.
Walkability and Republican lean
Places with a low walkability score tend to lean Republican; Bakersville, Manchester, NH sits below the national average on this measure. A walkable street grid does not change how people vote; it mostly reflects how urban a place is.
Why turnout in Bakersville looks the way it does
High-crime urban areas turn out at lower rates, mostly because the housing stress common in those areas makes voting harder. Bakersville sits in the top 15% nationally on a violent-crime measure. See CrimeGrade for more details. Learn more about the findings and methodology on the political spectrum map.
Nearby Neighborhoods
- Highlands, Manchester, NH D+11
- Somerville, Manchester, NH D+26
- Piscataquog, Manchester, NH D+24
- Kalivas Union, Manchester, NH D+32
- Downtown, Manchester, NH D+44
- Hallsville, Manchester, NH D+21
- Rimmon Heights, Manchester, NH D+24
- Straw-Smyth, Manchester, NH D+32
- Youngsville, Manchester, NH Even
- Wellington, Manchester, NH D+21
Neighborhoods with Similar Populations
- Lake Ridge, Fort Lauderdale, FL D+17
- North Lake Waco, Waco, TX R+54
- Poncey-Highland, Atlanta, GA D+67
- Park West, San Diego, CA D+54
- Western Washington University, Bellingham, WA D+73
- Northeast Heights, Wichita, KS D+48
- Agua Dulce, El Paso, TX D+8
- Calton Gardens, Laredo, TX D+9
- Diamond Heights, San Francisco, CA D+71
- Rogers Park, Fort Collins, CO D+46
Sources and methodology
Precinct-level voting records used to fit the model come from New Hampshire Secretary of State, Elections Division, distributed by the Voting and Election Science Team. Demographic inputs come from the U.S. Census Bureau (ACS 5-year estimates and the 2020 Decennial Census). Health and environmental inputs come from the CDC (PLACES and the Environmental Justice Index). Land cover comes from the USGS and EPA. Election-day and lead-up weather come from PRISM 4km daily grids and the NOAA Global Historical Climatology Network. Mail-voting and election-administration patterns come from the MIT Election Lab's Survey of the Performance of American Elections. Block-group crime detail comes from CrimeGrade. Internet data and modeling support provided by ISPreports.org.
Modeling and analysis by the BestNeighborhood data science team. NH did not have precinct-level voting records available for training, so the figures here come from extrapolation across demographic, health, and land-use features rather than local ground truth. Full methodology and findings: political spectrum map.
Methodology reviewed by the BestNeighborhood data team. Last updated May 2026.