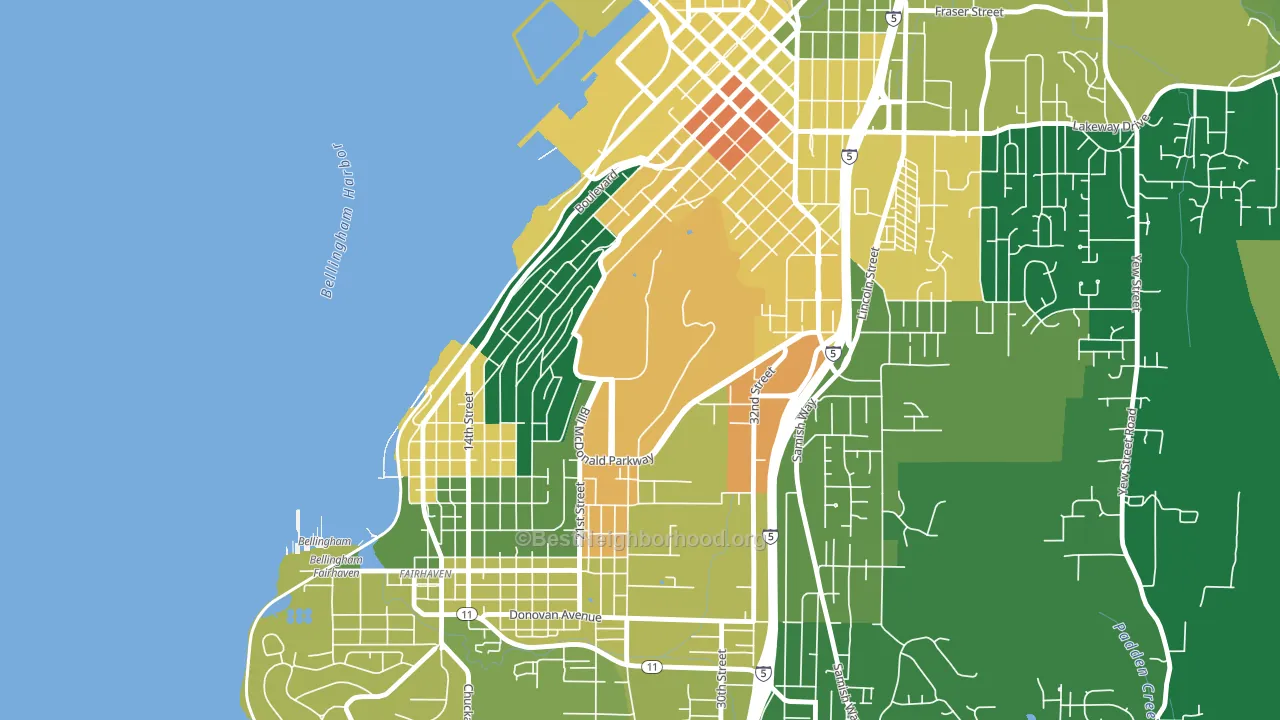
Western Washington University is a Democratic stronghold. About 86% of voters here vote Democratic and 14% Republican.
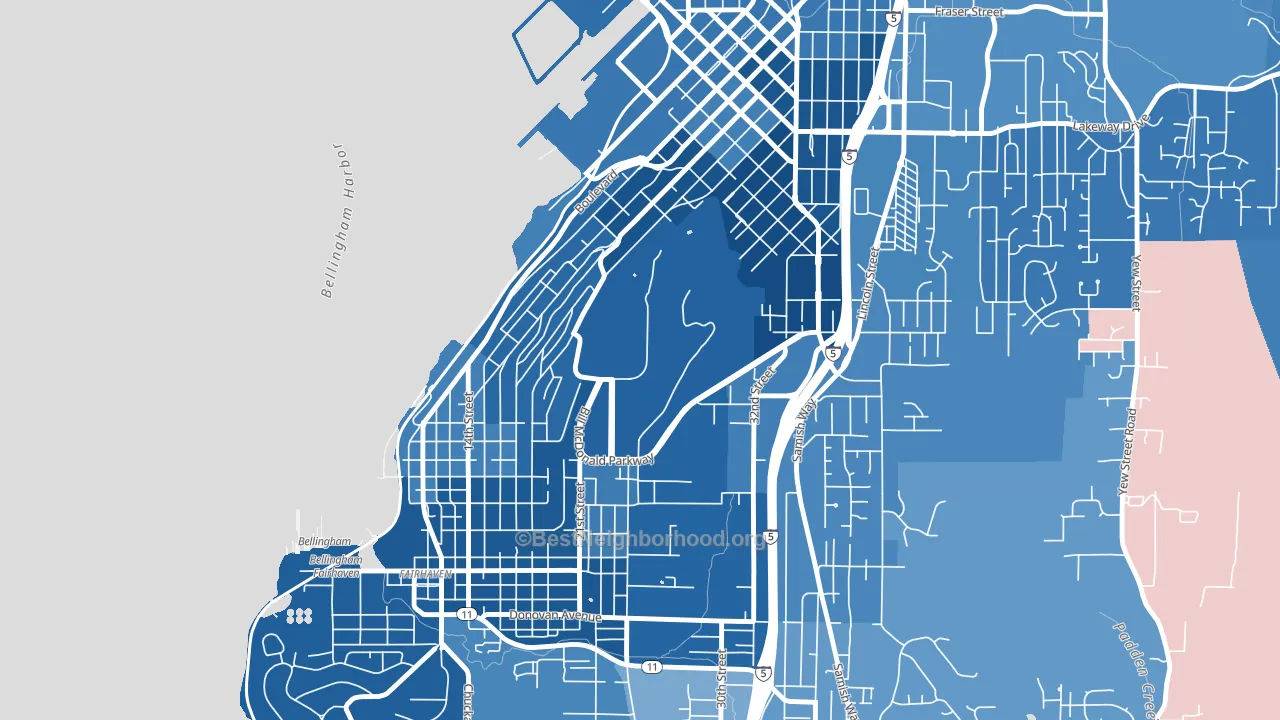
About 41% of adults in Western Washington University typically vote, below the U.S. average of about 62%. Among adults in Western Washington University, ~35% vote Democratic, ~6% Republican, and ~59% don't vote. The map below shows estimated turnout by block group.
How Western Washington University compares
Among neighborhoods within 5 miles, Western Washington University leans more Democratic than 10 of 12 neighbors.
Western Washington University runs about 55 points more Democratic than Washington as a whole.
Why Western Washington University leans the way it does
This analysis examined 14,881 data points per neighborhood to find what predicts political lean and turnout. The items below are a few correlations that stood out for Western Washington University, not a ranked or complete list of what matters most.
Areas with many never-married adults vote Democratic. About 98% of adults in Western Washington University have never been married, far above similar-sized neighborhoods (around 34%).
Preventive-care access and voter turnout
Places with limited routine preventive-care access tend to turn out at a lower rate; Western Washington University, Bellingham, WA sits below the national average on this measure. Dental visits do not drive turnout; the rate reflects income, insurance, and healthcare access, which line up with who votes.
Why turnout in Western Washington University looks the way it does
Renters vote less often than owners. More than 99% of households in Western Washington University rent, about 74 points above the U.S. average of 25%. Low high-school completion lines up with lower turnout, and more than 99% of adults in Western Washington University have completed high school, above 98% of neighborhoods. High-crime urban areas turn out at lower rates, and Western Washington University sits in the top 15% on a violent-crime measure. Learn more about the findings and methodology on the political spectrum map.
Nearby Neighborhoods
- South Hill, Bellingham, WA D+67
- Sehome, Bellingham, WA D+74
- Happy Valley, Bellingham, WA D+69
- Samish Hill, Bellingham, WA D+56
- York, Bellingham, WA D+69
- Puget, Bellingham, WA D+48
- Lettered Streets, Bellingham, WA D+73
- Columbia, Bellingham, WA D+72
- Birchwood, Bellingham, WA D+46
- Mount Baker, Bellingham, WA D+46
Neighborhoods with Similar Populations
- Agua Dulce, El Paso, TX D+8
- Calton Gardens, Laredo, TX D+9
- Mission Lake, Kansas City, MO D+14
- Poncey-Highland, Atlanta, GA D+67
- Old Town, Beaumont, TX D+32
- Bakersville, Manchester, NH D+21
- Lake Ridge, Fort Lauderdale, FL D+17
- North Lake Waco, Waco, TX R+54
- Deercreek, Jacksonville, FL R+16
- City in the Hills, Bakersfield, CA R+23
Sources and methodology
Precinct-level voting records used to fit the model come from Washington Secretary of State, Elections, distributed by the Voting and Election Science Team. Demographic inputs come from the U.S. Census Bureau (ACS 5-year estimates and the 2020 Decennial Census). Health and environmental inputs come from the CDC (PLACES and the Environmental Justice Index). Land cover comes from the USGS and EPA. Election-day and lead-up weather come from PRISM 4km daily grids and the NOAA Global Historical Climatology Network. Mail-voting and election-administration patterns come from the MIT Election Lab's Survey of the Performance of American Elections. Block-group crime detail comes from CrimeGrade. Internet data and modeling support provided by ISPreports.org.
Modeling and analysis by the BestNeighborhood data science team. Full methodology and findings: political spectrum map.
Methodology reviewed by the BestNeighborhood data team. Last updated May 2026.