Bashford Manor leans heavily Democratic by roughly 40 points: about 70% of voters vote Democratic and 30% Republican.
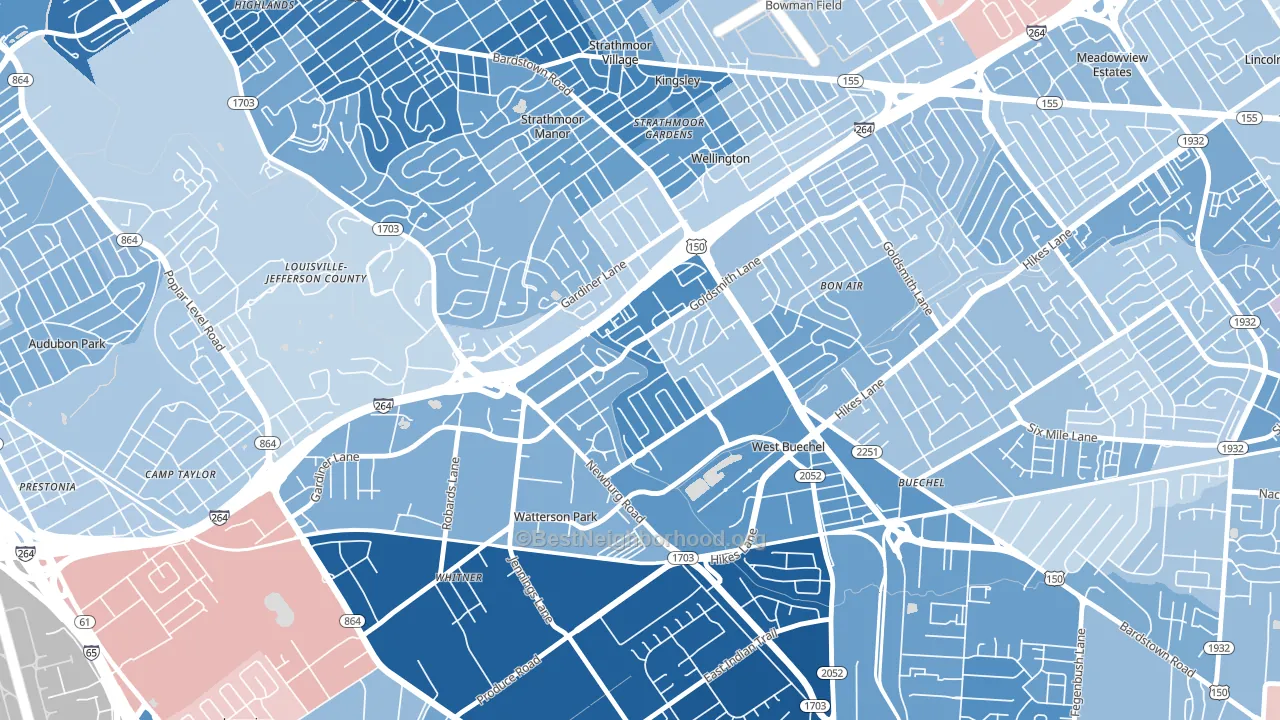
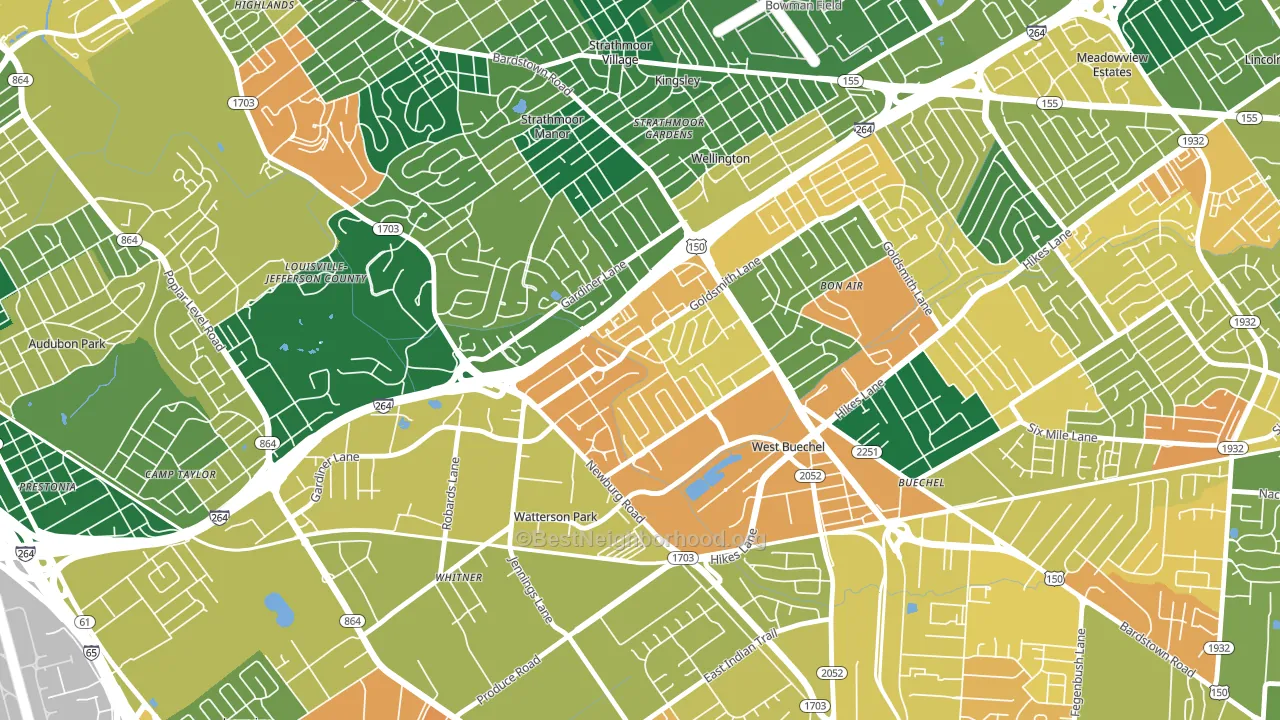
About 42% of adults in Bashford Manor typically vote, below the U.S. average of about 62%. Among adults in Bashford Manor, ~29% vote Democratic, ~13% Republican, and ~58% don't vote. The map below shows estimated turnout by block group.
How Bashford Manor compares
Among neighborhoods within 5 miles, Bashford Manor leans more Democratic than 9 of 21 neighbors.
Bashford Manor runs about 70 points more Democratic than Kentucky as a whole. Kentucky leans Republican overall, while Bashford Manor is one of the few Democratic-leaning pockets.
Politics vary noticeably by block within Bashford Manor. The north side is the most Democratic-leaning (D+48) and the east side is the least Democratic-leaning (D+25), a spread of about 23 points.
Why Bashford Manor leans the way it does
This analysis examined 14,881 data points per neighborhood to find what predicts political lean and turnout. The items below are a few correlations that stood out for Bashford Manor, not a ranked or complete list of what matters most.
Dense areas vote Democratic. More than 99% of residents in Bashford Manor live in densely developed areas, about 64 points above the U.S. average of 36%. Bashford Manor runs against the grain of Kentucky, a Democratic-leaning pocket in a Republican-leaning state.
Paved land cover and Democratic lean
Places with extensive paved surfaces tend to lean Democratic; Bashford Manor, Louisville, KY sits in the top quarter nationally on this measure. Paved ground does not change how people vote; it mostly reflects how urban and built-up a place is.
Why turnout in Bashford Manor looks the way it does
Renters vote less often than owners. About 67% of households in Bashford Manor rent, about 42 points above the U.S. average of 25%. Learn more about the findings and methodology on the political spectrum map.
Nearby Neighborhoods
- Bon Air, Louisville, KY D+31
- Belknap, Louisville, KY D+49
- Highlands Douglass, Louisville, KY D+57
- Buechel, Louisville, KY D+31
- Deer Park, Louisville, KY D+61
- Klondike, Louisville, KY D+23
- Bowman, Louisville, KY D+19
- Audubon, Louisville, KY D+24
- Hikes Point, Louisville, KY D+15
- Cherokee Triangle, Louisville, KY D+60
Neighborhoods with Similar Populations
- Uptown, Milwaukee, WI D+76
- Tollgate Overlook, Aurora, CO D+36
- Treme' Lafitte, New Orleans, LA D+76
- Highland Park, Chattanooga, TN D+42
- Mantua, Fairfax, VA D+40
- Southside, Birmingham, AL D+42
- Rolling Mill Hill, Wilkes-Barre, PA D+13
- Hampden South, Denver, CO D+37
- Montclair, Oakland, CA D+71
- Jacksonville Heights South, Jacksonville, FL D+10
Sources and methodology
Precinct-level voting records used to fit the model come from Kentucky State Board of Elections, distributed by the Voting and Election Science Team. Demographic inputs come from the U.S. Census Bureau (ACS 5-year estimates and the 2020 Decennial Census). Health and environmental inputs come from the CDC (PLACES and the Environmental Justice Index). Land cover comes from the USGS and EPA. Election-day and lead-up weather come from PRISM 4km daily grids and the NOAA Global Historical Climatology Network. Mail-voting and election-administration patterns come from the MIT Election Lab's Survey of the Performance of American Elections. Block-group crime detail comes from CrimeGrade. Internet data and modeling support provided by ISPreports.org.
Modeling and analysis by the BestNeighborhood data science team. Full methodology and findings: political spectrum map.
Methodology reviewed by the BestNeighborhood data team. Last updated May 2026.