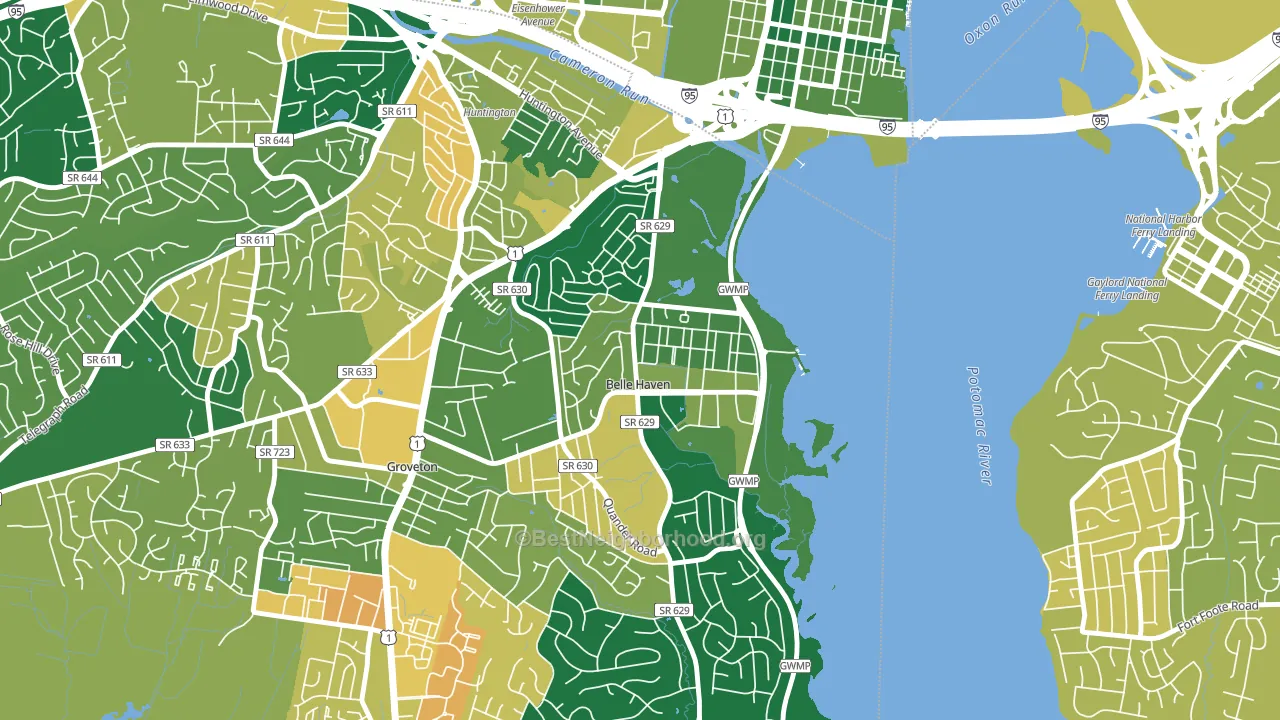
Belle Haven leans heavily Democratic by roughly 44 points: about 72% of voters vote Democratic and 28% Republican.
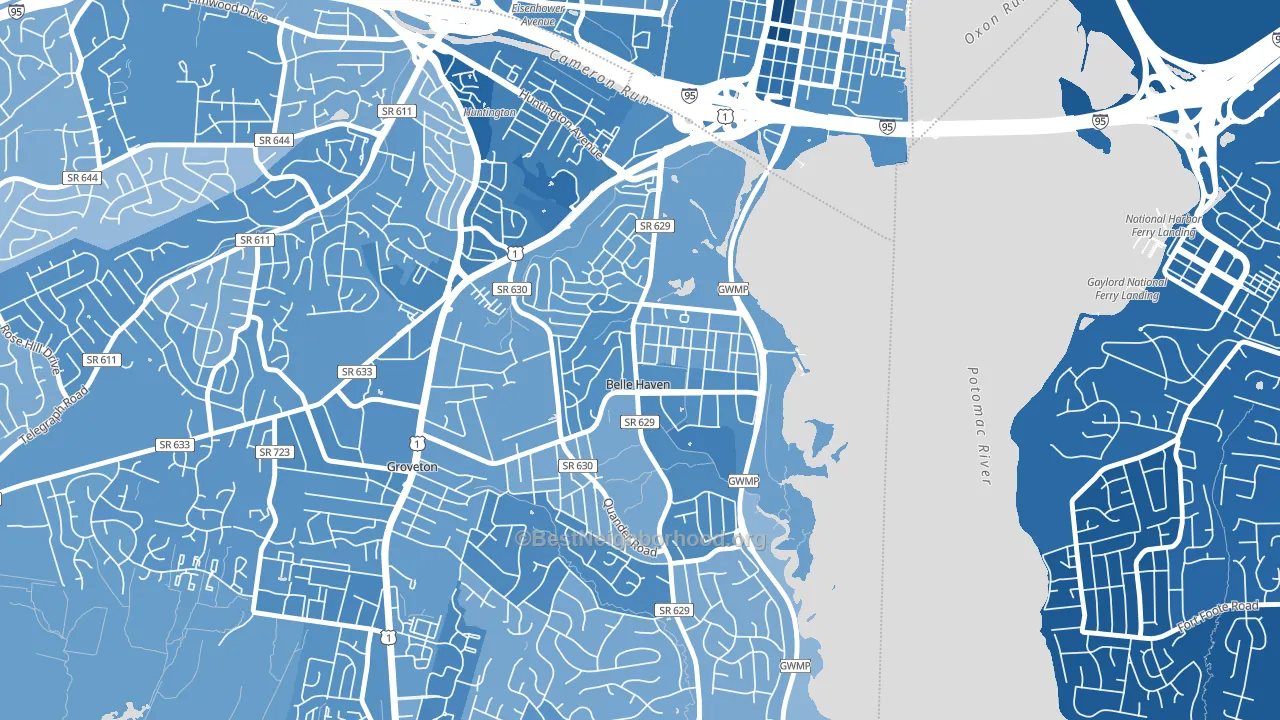
About 95% of adults in Belle Haven typically vote, above the U.S. average of about 62%. Among adults in Belle Haven, ~68% vote Democratic, ~27% Republican, and ~5% don't vote. The map below shows estimated turnout by block group.
How Belle Haven compares
Among neighborhoods within 5 miles, Belle Haven leans more Democratic than 3 of 19 neighbors.
Belle Haven runs about 39 points more Democratic than Virginia as a whole.
Politics vary noticeably by block within Belle Haven. The southeast side is the most Democratic-leaning (D+57) and the southwest side is the least Democratic-leaning (D+34), a spread of about 23 points.
Why Belle Haven leans the way it does
This analysis examined 14,881 data points per neighborhood to find what predicts political lean and turnout. The items below are a few correlations that stood out for Belle Haven, not a ranked or complete list of what matters most.
Areas with high college attainment vote Democratic. About 71% of adults in Belle Haven hold a bachelor's degree, about 42 points above the U.S. average of 28%.
Cancer-screening access and voter turnout
Places with high colon-cancer-screening access tend to turn out at a higher rate; Belle Haven, Belle View, VA sits in the top quarter nationally on this measure. Cancer screening does not drive turnout; it reflects income, insurance, and healthcare access.
Why turnout in Belle Haven looks the way it does
Areas with strong routine healthcare access turn out at higher rates. Belle Haven is in the top quarter nationally for routine-care measures such as insurance coverage, preventive screenings, and dental visits. The dental-visit rate here is about 78%, about 18 points above the U.S. average of 60%. Learn more about the findings and methodology on the political spectrum map.
Nearby Neighborhoods
- Groveton, Alexandria, VA D+49
- Southwest Quadrant, Alexandria, VA D+62
- Eisenhower East, Alexandria, VA D+52
- Old Town, Alexandria, VA D+54
- Hybla Valley, Alexandria, VA D+43
- Braddock Road Metro, Alexandria, VA D+65
- Taylor Run, Alexandria, VA D+50
- Rose Hill, Alexandria, VA D+42
- Potomac Yard-Potomac Greens, Alexandria, VA D+58
- Potomac West, Alexandria, VA D+60
Neighborhoods with Similar Populations
- Middlebury, Akron, OH D+42
- McKinley Avenue Corridor, Columbus, OH D+34
- Fairmont Park, Norfolk, VA D+63
- Terra del Sol, Tucson, AZ D+11
- Crestwood, Tuckahoe, NY D+5
- Vernon Hill, Worcester, MA D+30
- Cedar Knolls, Bronxville, NY D+26
- Lace, Darien, IL D+6
- Hedgeville, Wilmington, DE D+55
- Dam East-West, Aurora, CO D+36
Sources and methodology
Precinct-level voting records used to fit the model come from Virginia Department of Elections, distributed by the Voting and Election Science Team. Demographic inputs come from the U.S. Census Bureau (ACS 5-year estimates and the 2020 Decennial Census). Health and environmental inputs come from the CDC (PLACES and the Environmental Justice Index). Land cover comes from the USGS and EPA. Election-day and lead-up weather come from PRISM 4km daily grids and the NOAA Global Historical Climatology Network. Mail-voting and election-administration patterns come from the MIT Election Lab's Survey of the Performance of American Elections. Block-group crime detail comes from CrimeGrade. Internet data and modeling support provided by ISPreports.org.
Modeling and analysis by the BestNeighborhood data science team. Full methodology and findings: political spectrum map.
Methodology reviewed by the BestNeighborhood data team. Last updated May 2026.