Blair County leans heavily Republican by roughly 36 points: about 32% of voters vote Democratic and 68% Republican.
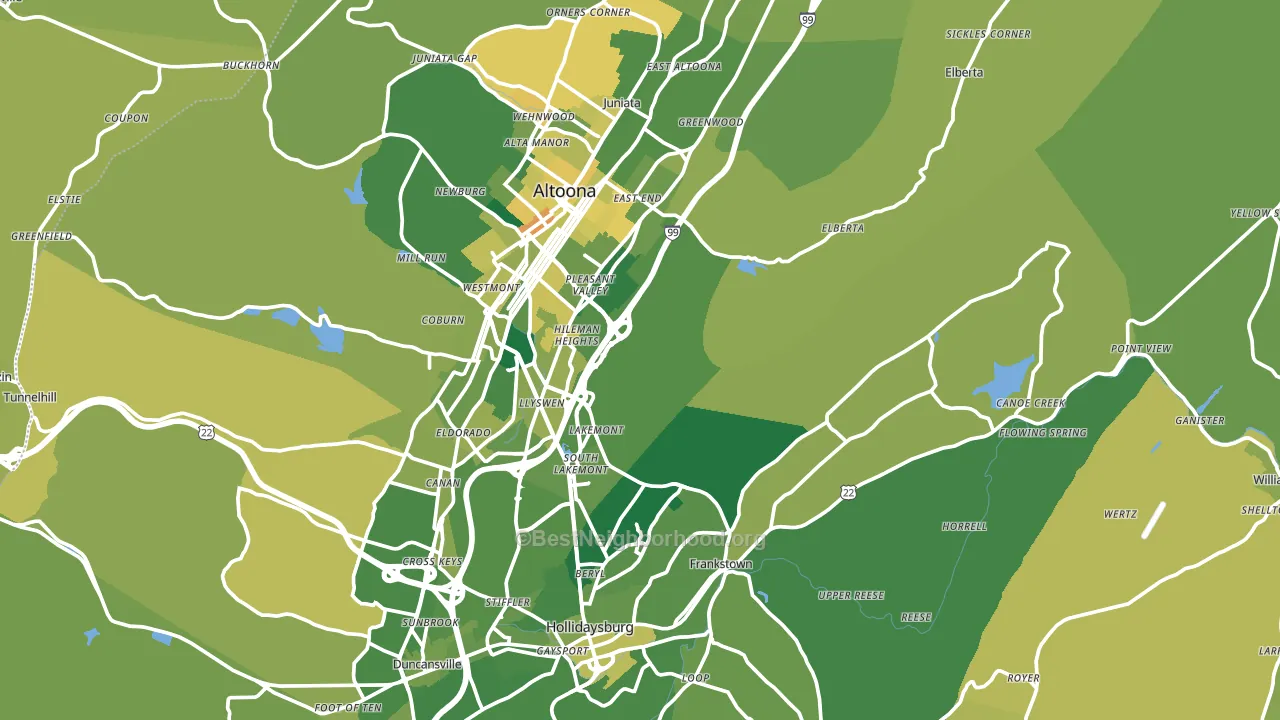
About 74% of adults in Blair County typically vote, above the U.S. average of about 62%. Among adults in Blair County, ~24% vote Democratic, ~51% Republican, and ~25% don't vote. The map below shows estimated turnout by block group.
How Blair County compares
Among counties within 50 miles, Blair County leans more Republican than 3 of 9 neighbors.
Blair County runs about 35 points more Republican than Pennsylvania as a whole.
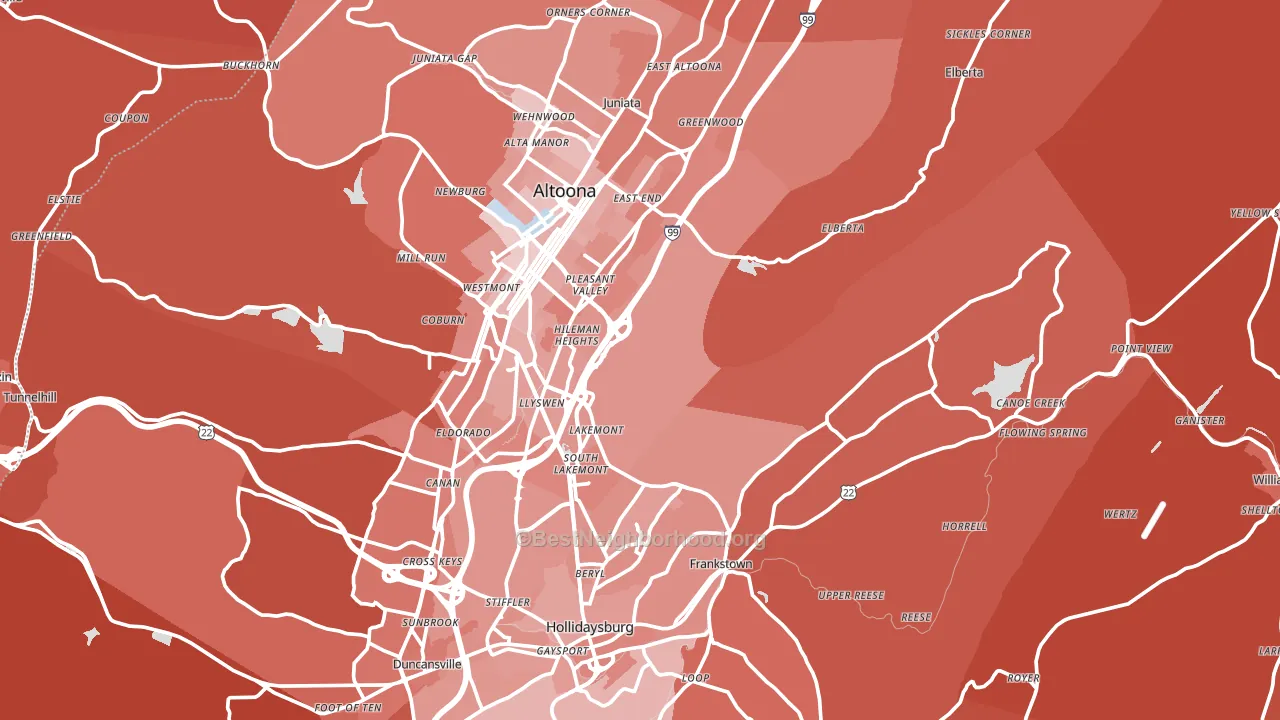
Politics vary noticeably by city within Blair County. The southeast side is the most Republican-leaning (R+55) and the west side is the least Republican-leaning (R+25), a spread of about 30 points.
Why Blair County leans the way it does
This analysis examined 14,881 data points per county to find what predicts political lean and turnout. The items below are a few correlations that stood out for Blair County, not a ranked or complete list of what matters most.
Blair County votes Republican even though it is densely developed (about 62%, well above the Pennsylvania average of 33%). State and regional patterns outweigh the Democratic lean that density usually predicts here.
Walkability and Democratic lean
Places with a highly walkable street grid tend to lean Democratic; Blair County, PA sits in the top quarter nationally on this measure. A walkable street grid does not change how people vote; it mostly reflects how urban a place is.
Why turnout in Blair County looks the way it does
Areas with high high-school completion turn out at higher rates. About 94% of adults in Blair County have completed high school, above 83% of counties. Learn more about the findings and methodology on the political spectrum map.
Nearby Counties
- Huntingdon County, PA R+46
- Cambria County, PA R+35
- Bedford County, PA R+66
- Clearfield County, PA R+46
- Centre County, PA D+8
- Indiana County, PA R+34
- Mifflin County, PA R+58
- Fulton County, PA R+70
- Somerset County, PA R+54
- Jefferson County, PA R+55
Counties with Similar Populations
- Jasper County, MO R+40
- Saline County, AR R+41
- Morgan County, AL R+43
- Faulkner County, AR R+30
- Berkeley County, WV R+33
- Kennebec County, ME R+7
- Bonneville County, ID R+43
- San Juan County, NM R+26
- Gregg County, TX R+28
- Comanche County, OK R+18
Sources and methodology
Precinct-level voting records used to fit the model come from Pennsylvania Department of State, Bureau of Elections, distributed by the Voting and Election Science Team. Demographic inputs come from the U.S. Census Bureau (ACS 5-year estimates and the 2020 Decennial Census). Health and environmental inputs come from the CDC (PLACES and the Environmental Justice Index). Land cover comes from the USGS and EPA. Election-day and lead-up weather come from PRISM 4km daily grids and the NOAA Global Historical Climatology Network. Mail-voting and election-administration patterns come from the MIT Election Lab's Survey of the Performance of American Elections. Block-group crime detail comes from CrimeGrade. Internet data and modeling support provided by ISPreports.org.
Modeling and analysis by the BestNeighborhood data science team. Full methodology and findings: political spectrum map.
Methodology reviewed by the BestNeighborhood data team. Last updated May 2026.