Boulevard Park is a Democratic stronghold. About 84% of voters here vote Democratic and 16% Republican.
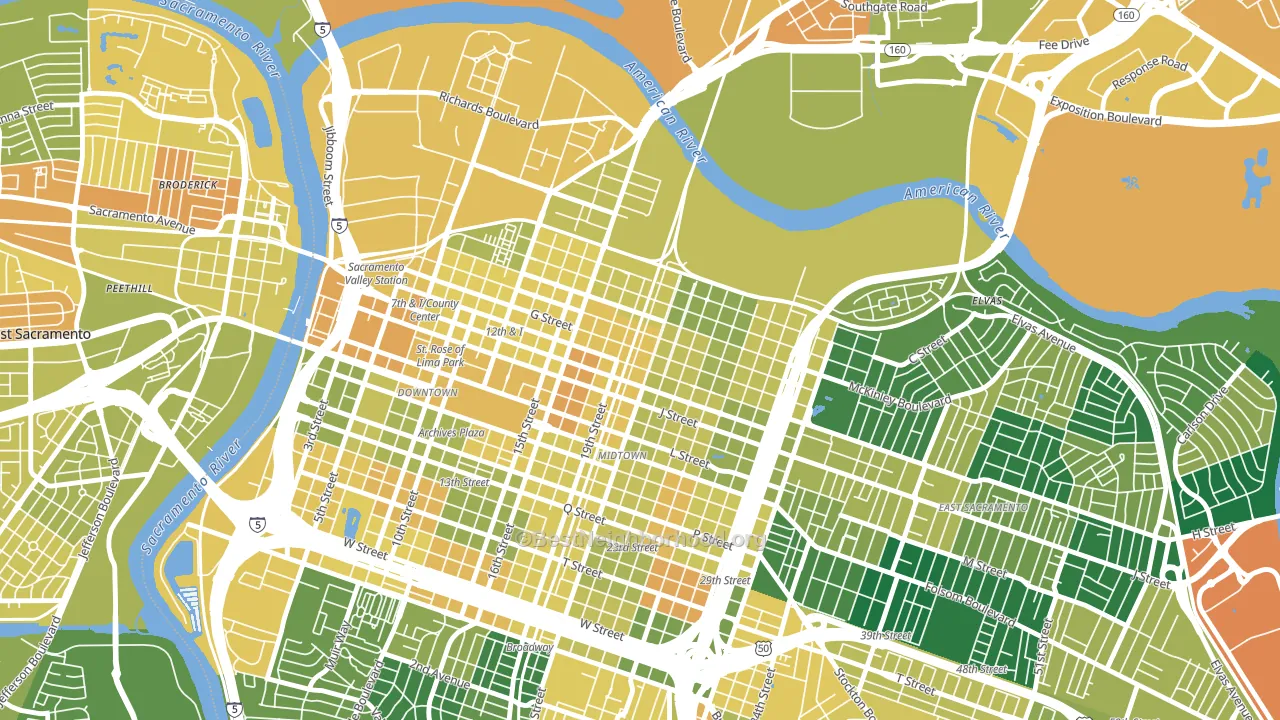
About 53% of adults in Boulevard Park typically vote, below the U.S. average of about 62%. Among adults in Boulevard Park, ~44% vote Democratic, ~9% Republican, and ~47% don't vote. The map below shows estimated turnout by block group.
How Boulevard Park compares
Among neighborhoods within 5 miles, Boulevard Park leans more Democratic than 40 of 42 neighbors.
Boulevard Park runs about 48 points more Democratic than California as a whole.
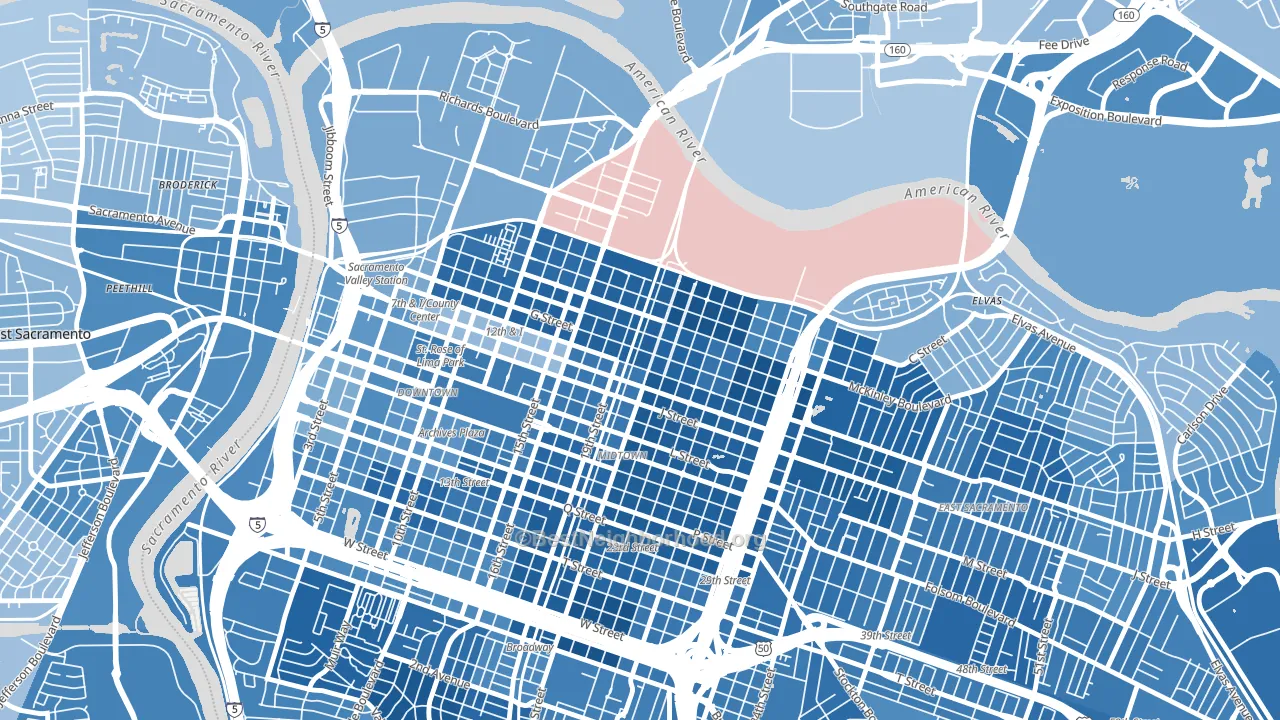
Politics vary noticeably by block within Boulevard Park. The north side is the most Democratic-leaning (D+75) and the southwest side is the least Democratic-leaning (D+56), a spread of about 19 points.
Why Boulevard Park leans the way it does
This analysis examined 14,881 data points per neighborhood to find what predicts political lean and turnout. The items below are a few correlations that stood out for Boulevard Park, not a ranked or complete list of what matters most.
Dense areas vote Democratic. More than 99% of residents in Boulevard Park live in densely developed areas, about 64 points above the U.S. average of 36%. High college attainment predicts Democratic voting, and Boulevard Park sits in the top quarter (about 63%, above 84% of neighborhoods). A high never-married share predicts Democratic voting, and about 63% of adults in Boulevard Park have never been married, above 95% of neighborhoods.
Population density and Democratic lean
Places with high population density tend to lean Democratic; Boulevard Park, Sacramento, CA sits in the top tenth nationally on this measure.
Why turnout in Boulevard Park looks the way it does
Renters vote less often than owners. About 79% of households in Boulevard Park rent, about 54 points above the U.S. average of 25%. High-crime urban areas turn out at lower rates, and Boulevard Park sits in the top 15% on a violent-crime measure. Learn more about the findings and methodology on the political spectrum map.
Nearby Neighborhoods
- Midtown, Sacramento, CA D+71
- Downtown Sacramento, Sacramento, CA D+46
- Richmond Grove, Sacramento, CA D+66
- East Sacramento, Sacramento, CA D+59
- North Oak Park, Sacramento, CA D+70
- Curtis Park, Sacramento, CA D+66
- Land Park, Sacramento, CA D+63
- River Gardens, Sacramento, CA D+33
- Upper Land Park, Sacramento, CA D+65
- River Park, Sacramento, CA D+41
Neighborhoods with Similar Populations
- Palm Beach Lakes, West Palm Beach, FL D+58
- Forest Park, Pine Hills, FL D+69
- Colonial Heights, Sacramento, CA D+52
- 9th Ward, Wilmington, DE D+85
- Esther Short, Vancouver, WA D+46
- Baker, Mobile, AL R+29
- Duval-Eagle Eyes Crime Watch, Gainesville, FL D+80
- Mack South, Cincinnati, OH R+51
- Strawberry Manor, Sacramento, CA D+40
- Western Hills, San Mateo, CA D+41
Sources and methodology
Precinct-level voting records used to fit the model come from California Secretary of State, Elections, distributed by the Voting and Election Science Team. Demographic inputs come from the U.S. Census Bureau (ACS 5-year estimates and the 2020 Decennial Census). Health and environmental inputs come from the CDC (PLACES and the Environmental Justice Index). Land cover comes from the USGS and EPA. Election-day and lead-up weather come from PRISM 4km daily grids and the NOAA Global Historical Climatology Network. Mail-voting and election-administration patterns come from the MIT Election Lab's Survey of the Performance of American Elections. Block-group crime detail comes from CrimeGrade. Internet data and modeling support provided by ISPreports.org.
Modeling and analysis by the BestNeighborhood data science team. Full methodology and findings: political spectrum map.
Methodology reviewed by the BestNeighborhood data team. Last updated May 2026.