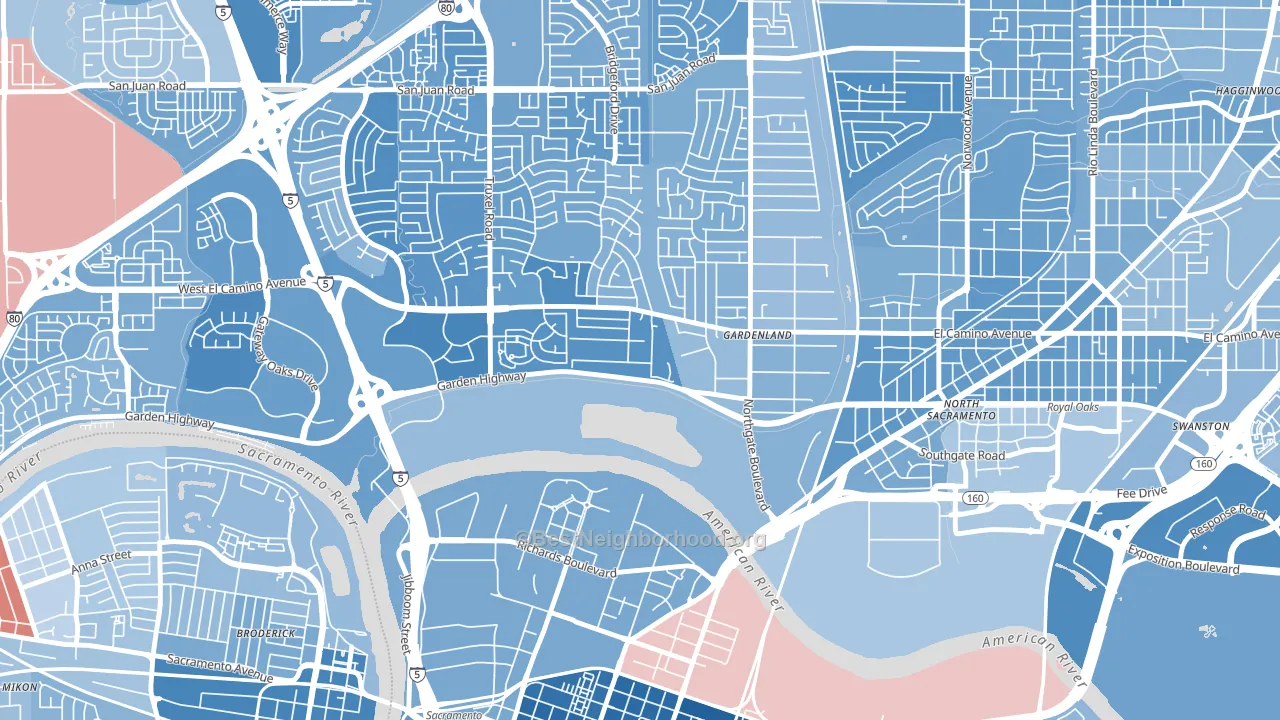
River Gardens leans heavily Democratic by roughly 34 points: about 67% of voters vote Democratic and 33% Republican.
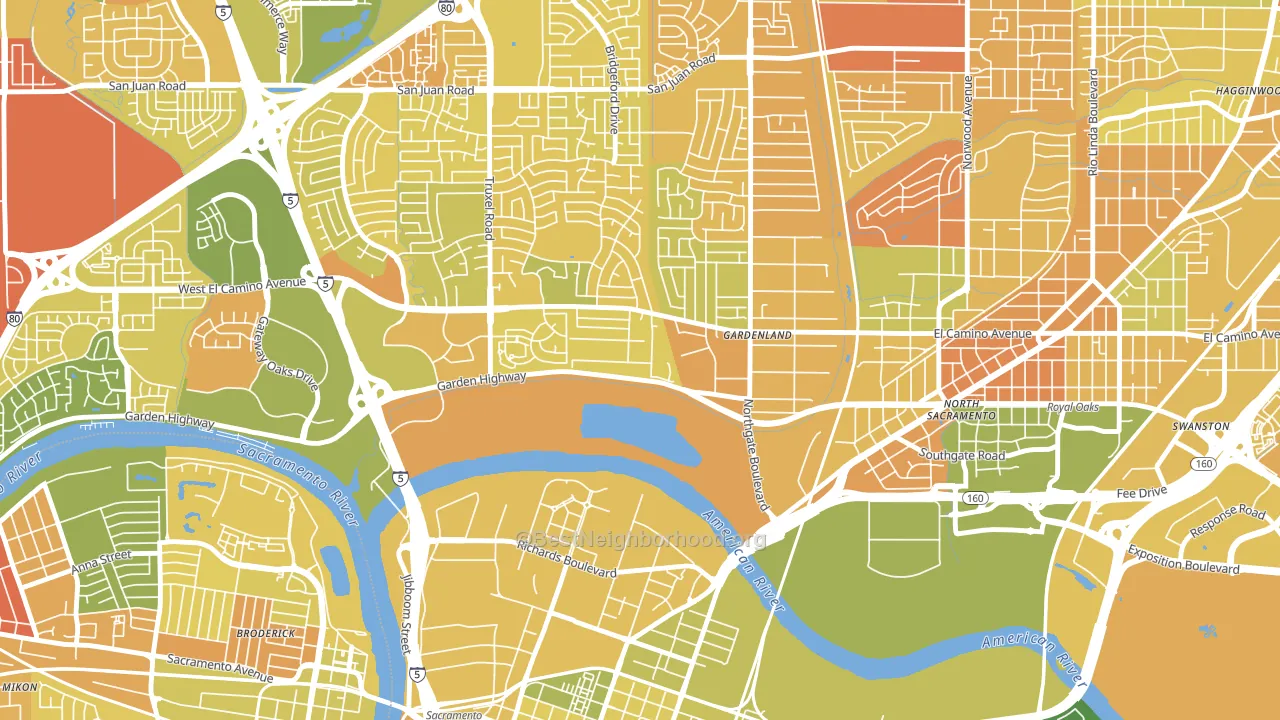
About 44% of adults in River Gardens typically vote, below the U.S. average of about 62%. Among adults in River Gardens, ~29% vote Democratic, ~14% Republican, and ~57% don't vote. The map below shows estimated turnout by block group.
How River Gardens compares
Among neighborhoods within 5 miles, River Gardens leans more Democratic than 18 of 39 neighbors.
River Gardens runs about 13 points more Democratic than California as a whole.
Why River Gardens leans the way it does
This analysis examined 14,881 data points per neighborhood to find what predicts political lean and turnout. The items below are a few correlations that stood out for River Gardens, not a ranked or complete list of what matters most.
Areas with many never-married adults vote Democratic. About 53% of adults in River Gardens have never been married, well above similar-sized neighborhoods (around 37%).
Walkability and Democratic lean
Places with a highly walkable street grid tend to lean Democratic; River Gardens, Sacramento, CA sits in the top quarter nationally on this measure. A walkable street grid does not change how people vote; it mostly reflects how urban a place is.
Why turnout in River Gardens looks the way it does
Renters vote less often than owners. About 75% of households in River Gardens rent, about 50 points above the U.S. average of 25%. Crowded housing lines up with lower turnout, and about 9% of homes in River Gardens have more than one occupant per room, above 89% of neighborhoods. High-crime urban areas turn out at lower rates, and River Gardens sits in the top 15% on a violent-crime measure. Learn more about the findings and methodology on the political spectrum map.
Nearby Neighborhoods
- Gardenland, Sacramento, CA D+24
- South Natomas, Sacramento, CA D+37
- Northgate Sacramento, Sacramento, CA D+32
- Noralto, Sacramento, CA D+34
- Gateway Center, Sacramento, CA D+48
- Strawberry Manor, Sacramento, CA D+40
- Old North Sacramento, Sacramento, CA D+39
- Downtown Sacramento, Sacramento, CA D+46
- Boulevard Park, Sacramento, CA D+68
- West del Paso Heights, Sacramento, CA D+31
Neighborhoods with Similar Populations
- Everroad Park, Columbus, IN R+22
- Clifton Heights, St. Louis, MO D+36
- Bellalago, Kissimmee, FL D+9
- Buckingham Park, Willingboro, NJ D+78
- Hillsmere Shores, Annapolis Neck, MD D+19
- Dover Heights, Toms River, NJ R+27
- SR Marmon, Albuquerque, NM D+13
- Cody, Mobile, AL D+71
- Spencer View Terrace, Deer Park, TX R+22
- Starview, Redding, CA R+27
Sources and methodology
Precinct-level voting records used to fit the model come from California Secretary of State, Elections, distributed by the Voting and Election Science Team. Demographic inputs come from the U.S. Census Bureau (ACS 5-year estimates and the 2020 Decennial Census). Health and environmental inputs come from the CDC (PLACES and the Environmental Justice Index). Land cover comes from the USGS and EPA. Election-day and lead-up weather come from PRISM 4km daily grids and the NOAA Global Historical Climatology Network. Mail-voting and election-administration patterns come from the MIT Election Lab's Survey of the Performance of American Elections. Block-group crime detail comes from CrimeGrade. Internet data and modeling support provided by ISPreports.org.
Modeling and analysis by the BestNeighborhood data science team. Full methodology and findings: political spectrum map.
Methodology reviewed by the BestNeighborhood data team. Last updated May 2026.