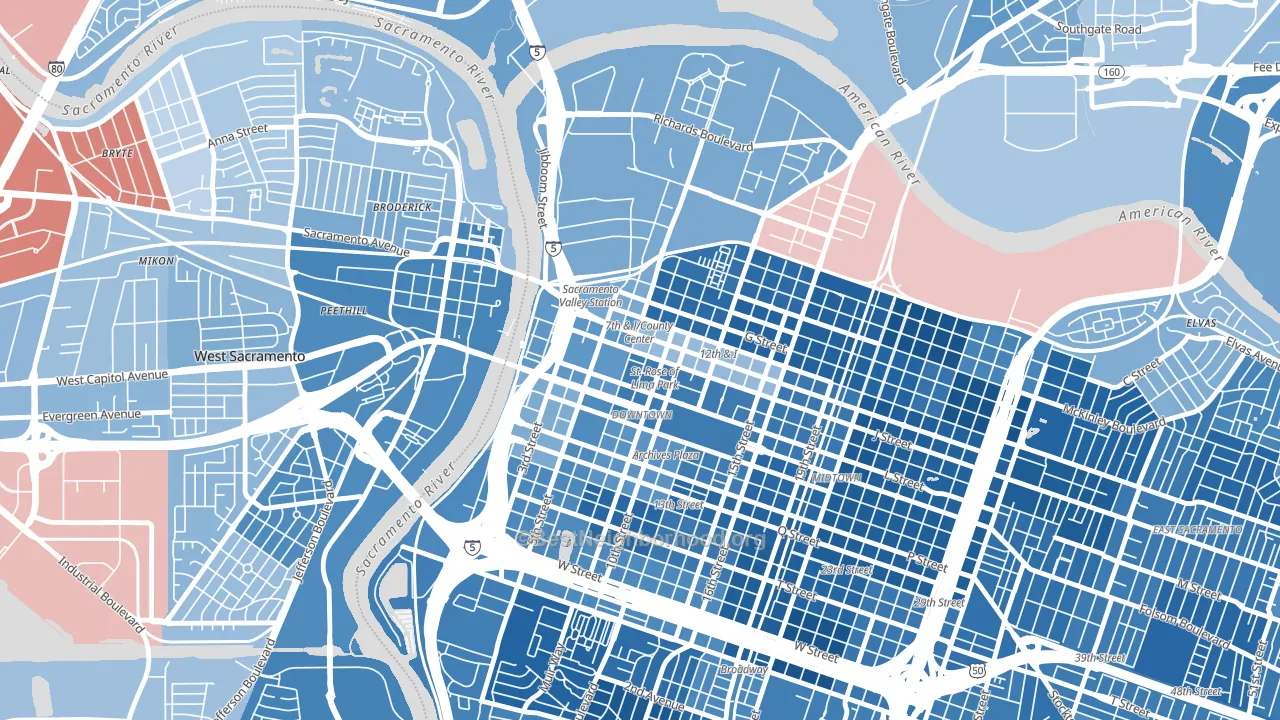
Downtown Sacramento leans heavily Democratic by roughly 46 points: about 73% of voters vote Democratic and 27% Republican.
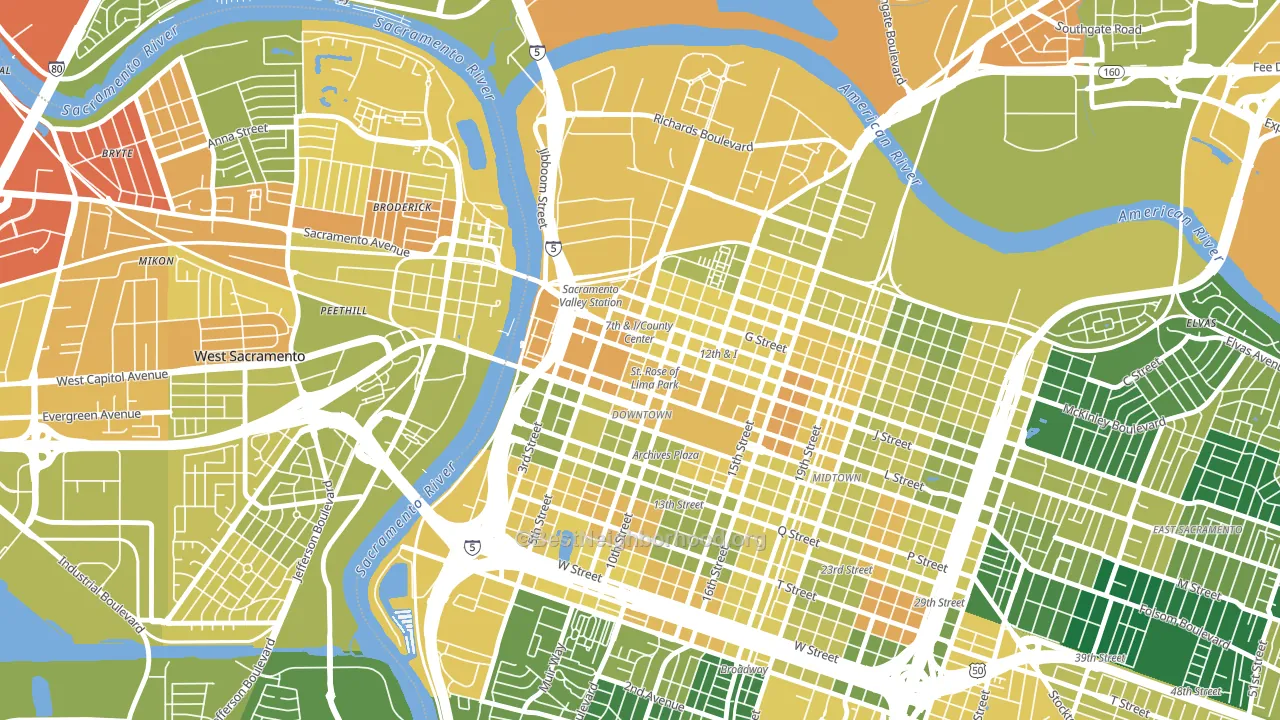
About 36% of adults in Downtown Sacramento typically vote, below the U.S. average of about 62%. Among adults in Downtown Sacramento, ~26% vote Democratic, ~10% Republican, and ~64% don't vote. The map below shows estimated turnout by block group.
How Downtown Sacramento compares
Among neighborhoods within 5 miles, Downtown Sacramento leans more Democratic than 22 of 37 neighbors.
Downtown Sacramento runs about 26 points more Democratic than California as a whole.
Politics vary noticeably by block within Downtown Sacramento. The southeast side is the most Democratic-leaning (D+66) and the northwest side is the least Democratic-leaning (D+42), a spread of about 23 points.
Why Downtown Sacramento leans the way it does
This analysis examined 14,881 data points per neighborhood to find what predicts political lean and turnout. The items below are a few correlations that stood out for Downtown Sacramento, not a ranked or complete list of what matters most.
Areas with many never-married adults vote Democratic. About 47% of adults in Downtown Sacramento have never been married, about 17 points above the U.S. average of 29%.
Preventive-care access and voter turnout
Places with limited routine preventive-care access tend to turn out at a lower rate; Downtown Sacramento, Sacramento, CA sits in the bottom tenth nationally on this measure. Dental visits do not drive turnout; the rate reflects income, insurance, and healthcare access, which line up with who votes.
Why turnout in Downtown Sacramento looks the way it does
Renters vote less often than owners. About 85% of households in Downtown Sacramento rent, about 60 points above the U.S. average of 25%. Limited routine healthcare access lines up with lower turnout, and Downtown Sacramento sits in the bottom quarter on routine-care measures. High-crime urban areas turn out at lower rates, and Downtown Sacramento sits in the top 15% on a violent-crime measure. Learn more about the findings and methodology on the political spectrum map.
Nearby Neighborhoods
- Boulevard Park, Sacramento, CA D+68
- Richmond Grove, Sacramento, CA D+66
- Midtown, Sacramento, CA D+71
- Upper Land Park, Sacramento, CA D+65
- Land Park, Sacramento, CA D+63
- River Gardens, Sacramento, CA D+33
- Bryte, West Sacramento, CA D+8
- Gateway Center, Sacramento, CA D+48
- Curtis Park, Sacramento, CA D+66
- North Oak Park, Sacramento, CA D+70
Neighborhoods with Similar Populations
- Plymouth-Exchange, Rochester, NY D+75
- Garden City, Cranston, RI D+10
- Confederate Point, Jacksonville, FL D+20
- East Meyer, Kansas City, MO D+80
- Wasatch Hollow, Salt Lake City, UT D+67
- Canterbury Green, Fort Wayne, IN D+21
- Melrose-Rugby, Roanoke, VA D+81
- Sun Willows, Pasco, WA D+13
- Las Palmas, San Antonio, TX D+35
- Boca Teeca, Boca Raton, FL Even
Sources and methodology
Precinct-level voting records used to fit the model come from California Secretary of State, Elections, distributed by the Voting and Election Science Team. Demographic inputs come from the U.S. Census Bureau (ACS 5-year estimates and the 2020 Decennial Census). Health and environmental inputs come from the CDC (PLACES and the Environmental Justice Index). Land cover comes from the USGS and EPA. Election-day and lead-up weather come from PRISM 4km daily grids and the NOAA Global Historical Climatology Network. Mail-voting and election-administration patterns come from the MIT Election Lab's Survey of the Performance of American Elections. Block-group crime detail comes from CrimeGrade. Internet data and modeling support provided by ISPreports.org.
Modeling and analysis by the BestNeighborhood data science team. Full methodology and findings: political spectrum map.
Methodology reviewed by the BestNeighborhood data team. Last updated May 2026.