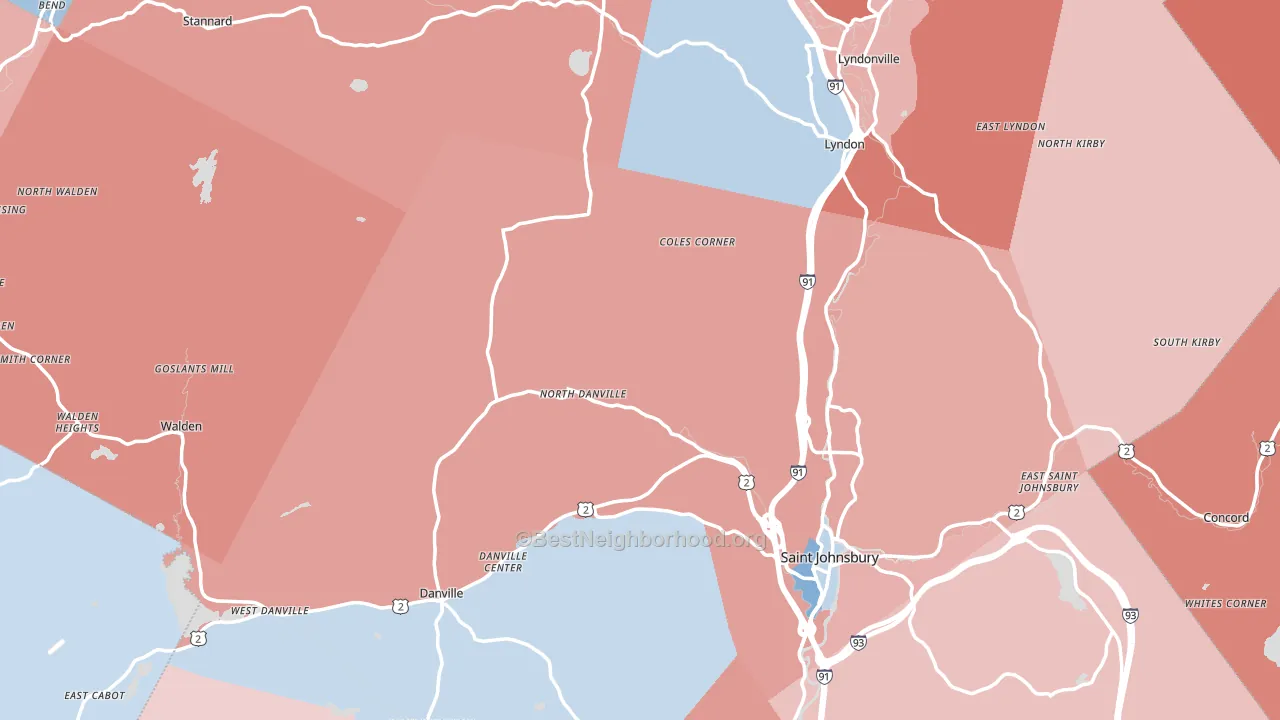
Caledonia County leans slightly Republican by roughly 10 points: about 45% of voters vote Democratic and 55% Republican. These figures are model estimates: Vermont did not have precinct-level voting records available for training, so the numbers above come from demographic and health features rather than local ground truth.
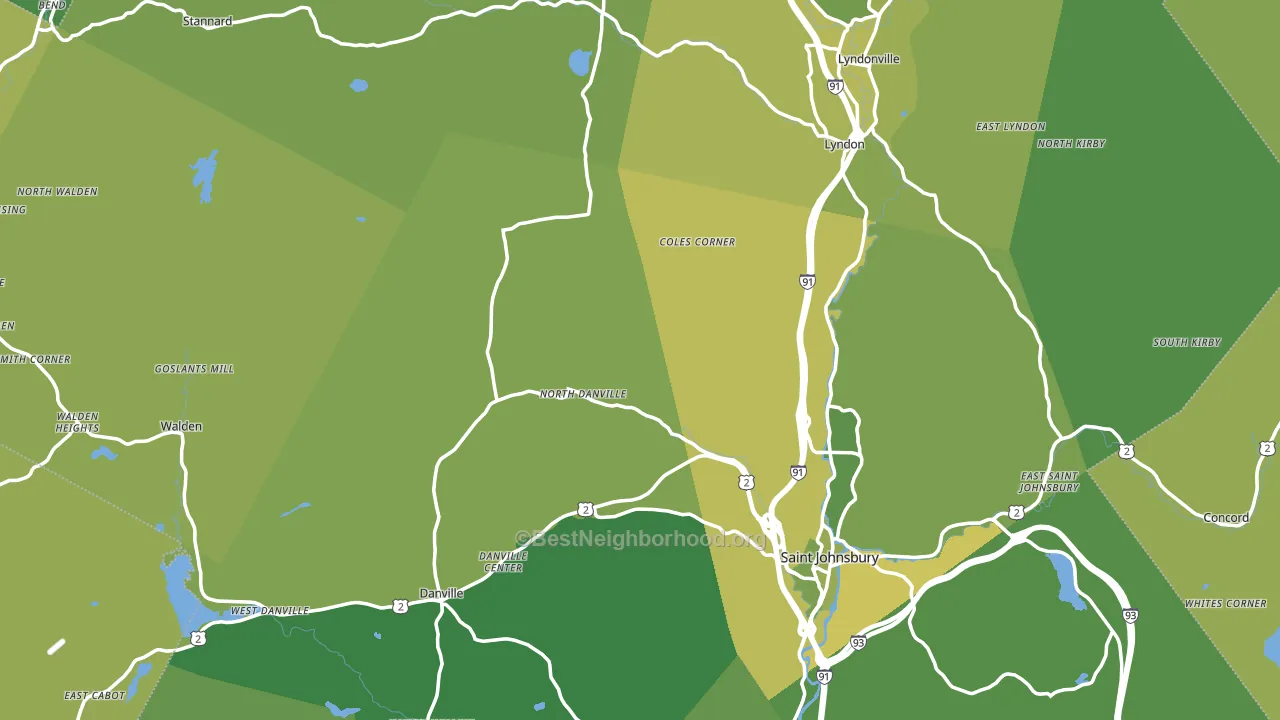
About 77% of adults in Caledonia County typically vote, above the U.S. average of about 62%. Among adults in Caledonia County, ~35% vote Democratic, ~42% Republican, and ~23% don't vote. The map below shows estimated turnout by block group.
How Caledonia County compares
Among counties within 50 miles, Caledonia County leans more Republican than 4 of 7 neighbors.
Caledonia County runs about 42 points more Republican than Vermont as a whole. Vermont leans Democratic overall, while Caledonia County is one of the few Republican-leaning pockets.
Politics vary noticeably by city within Caledonia County. The north side is the most split-leaning (R+19) and the southwest side is the least split-leaning (R+3), a spread of about 16 points.
Why Caledonia County leans the way it does
This analysis examined 14,881 data points per county to find what predicts political lean and turnout. The items below are a few correlations that stood out for Caledonia County, not a ranked or complete list of what matters most.
Caledonia County votes against the grain of Vermont. Vermont leans Democratic overall, while Caledonia County runs about 42 points more Republican.
Park access and Republican lean
Places with low park coverage tend to lean Republican; Caledonia County, VT sits in the bottom quarter nationally on this measure. Park access does not change how people vote; it tends to track denser, higher-income areas.
Why turnout in Caledonia County looks the way it does
Areas with high high-school completion turn out at higher rates. About 94% of adults in Caledonia County have completed high school, above 82% of counties. Learn more about the findings and methodology on the political spectrum map.
Nearby Counties
- Essex County, VT R+31
- Orleans County, VT R+17
- Washington County, VT D+19
- Lamoille County, VT D+7
- Coos County, NH R+24
- Orange County, VT Even
- Grafton County, NH D+18
- Franklin County, VT R+23
- Chittenden County, VT D+35
- Addison County, VT D+23
Counties with Similar Populations
- Iberville Parish, LA R+6
- McPherson County, KS R+44
- Knox County, KY R+65
- Ottawa County, OK R+53
- Austin County, TX R+54
- Randolph County, IL R+45
- Mecklenburg County, VA R+17
- Wayne County, GA R+52
- Powhatan County, VA R+38
- Giles County, TN R+57
Sources and methodology
Precinct-level voting records used to fit the model come from Vermont Secretary of State, Elections Division, distributed by the Voting and Election Science Team. Demographic inputs come from the U.S. Census Bureau (ACS 5-year estimates and the 2020 Decennial Census). Health and environmental inputs come from the CDC (PLACES and the Environmental Justice Index). Land cover comes from the USGS and EPA. Election-day and lead-up weather come from PRISM 4km daily grids and the NOAA Global Historical Climatology Network. Mail-voting and election-administration patterns come from the MIT Election Lab's Survey of the Performance of American Elections. Block-group crime detail comes from CrimeGrade. Internet data and modeling support provided by ISPreports.org.
Modeling and analysis by the BestNeighborhood data science team. VT did not have precinct-level voting records available for training, so the figures here come from extrapolation across demographic, health, and land-use features rather than local ground truth. Full methodology and findings: political spectrum map.
Methodology reviewed by the BestNeighborhood data team. Last updated May 2026.