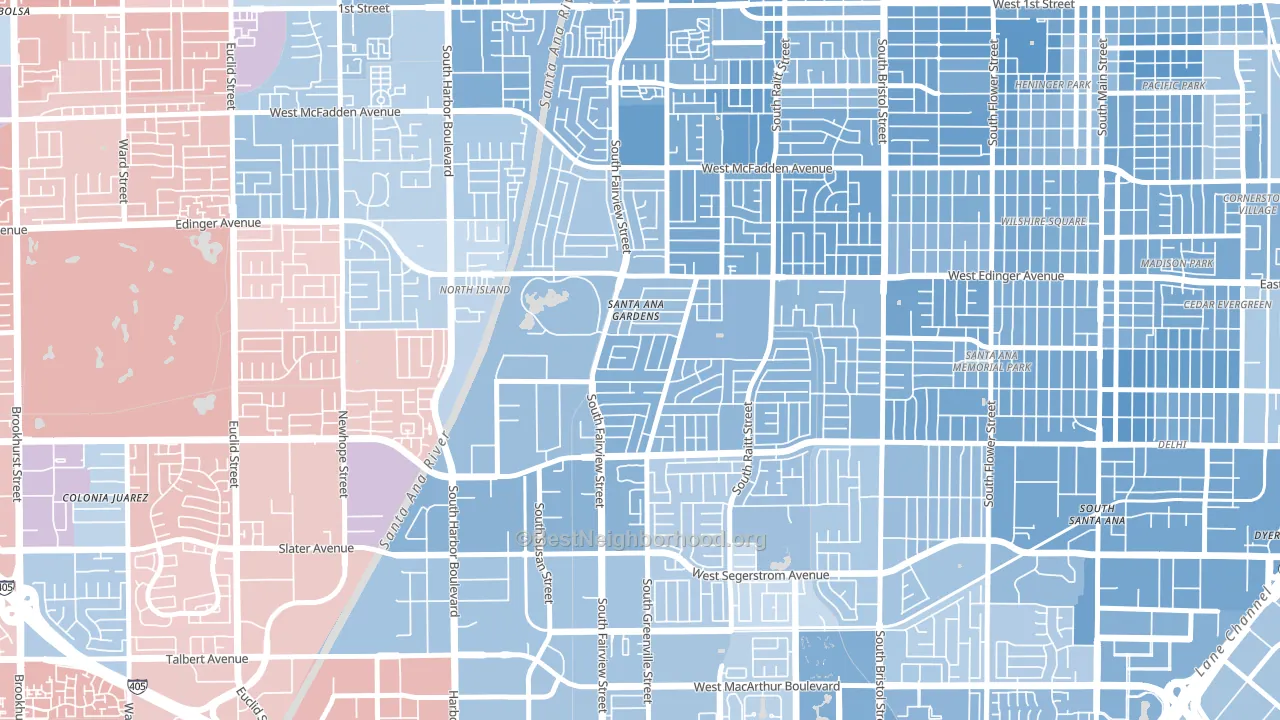
Centennial Park leans Democratic by roughly 24 points: about 62% of voters vote Democratic and 38% Republican.
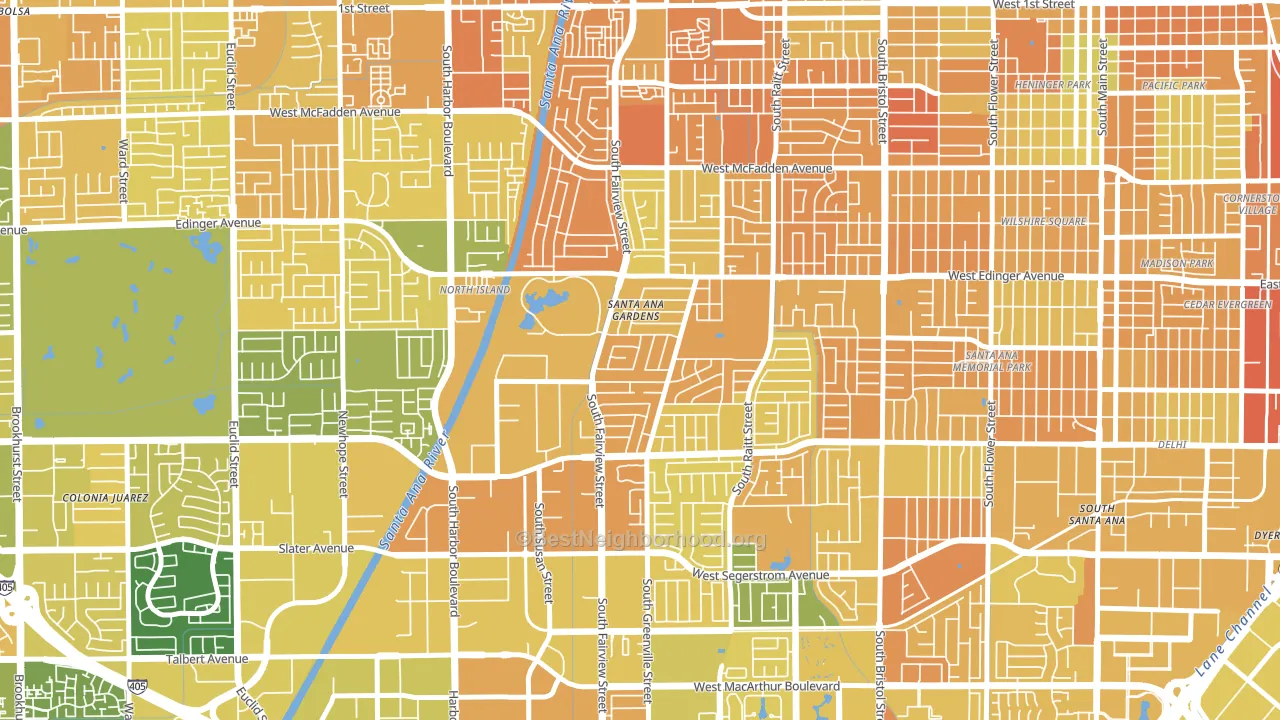
About 35% of adults in Centennial Park typically vote, below the U.S. average of about 62%. Among adults in Centennial Park, ~22% vote Democratic, ~13% Republican, and ~65% don't vote. The map below shows estimated turnout by block group.
How Centennial Park compares
Among neighborhoods within 5 miles, Centennial Park leans more Democratic than 18 of 36 neighbors.
Centennial Park runs about 4 points more Democratic than California as a whole.
Why Centennial Park leans the way it does
This analysis examined 14,881 data points per neighborhood to find what predicts political lean and turnout. The items below are a few correlations that stood out for Centennial Park, not a ranked or complete list of what matters most.
Areas with many never-married adults vote Democratic. About 49% of adults in Centennial Park have never been married, modestly above similar-sized neighborhoods (around 42%).
Paved land cover and Democratic lean
Places with extensive paved surfaces tend to lean Democratic; Centennial Park, Santa Ana, CA sits in the top tenth nationally on this measure. Paved ground does not change how people vote; it mostly reflects how urban and built-up a place is.
Why turnout in Centennial Park looks the way it does
Areas with limited routine healthcare access turn out at lower rates. Centennial Park is in the bottom quarter nationally for routine-care measures such as insurance coverage, preventive screenings, and dental visits. The uninsured rate here is about 22%, about 12 points above the California average of 10%. High food insecurity lines up with lower turnout, and about 30% of adults in Centennial Park report food insecurity, above 83% of neighborhoods. Low high-school completion lines up with lower turnout, and about 61% of adults in Centennial Park have completed high school, below 98% of neighborhoods. Learn more about the findings and methodology on the political spectrum map.
Nearby Neighborhoods
- Valley Adams, Santa Ana, CA D+23
- Windsor Village, Santa Ana, CA D+19
- New Horizons, Santa Ana, CA D+33
- Townsend-Raitt, Santa Ana, CA D+34
- Thornton Park, Santa Ana, CA D+18
- Mid City-Santa Ana, Santa Ana, CA D+33
- Windsor Village North, Santa Ana, CA D+24
- Sunwood Central, Santa Ana, CA D+24
- Central City Santa Ana, Santa Ana, CA D+32
- Memorial Park, Santa Ana, CA D+31
Neighborhoods with Similar Populations
- North El Monte, Arcadia, CA D+13
- Fairoaks, Tampa, FL R+2
- East del Paso Heights, Sacramento, CA D+20
- Columbus Park, Omaha, NE D+36
- Arroyo Viejo, Oakland, CA D+66
- Terra Vista, Bakersfield, CA R+7
- Millside Heights, Riverside, NJ D+9
- East Village, Amherst, MA D+74
- Olentangy River Road, Columbus, OH D+34
- East Roseville Parkway, Roseville, CA R+3
Sources and methodology
Precinct-level voting records used to fit the model come from California Secretary of State, Elections, distributed by the Voting and Election Science Team. Demographic inputs come from the U.S. Census Bureau (ACS 5-year estimates and the 2020 Decennial Census). Health and environmental inputs come from the CDC (PLACES and the Environmental Justice Index). Land cover comes from the USGS and EPA. Election-day and lead-up weather come from PRISM 4km daily grids and the NOAA Global Historical Climatology Network. Mail-voting and election-administration patterns come from the MIT Election Lab's Survey of the Performance of American Elections. Block-group crime detail comes from CrimeGrade. Internet data and modeling support provided by ISPreports.org.
Modeling and analysis by the BestNeighborhood data science team. Full methodology and findings: political spectrum map.
Methodology reviewed by the BestNeighborhood data team. Last updated May 2026.