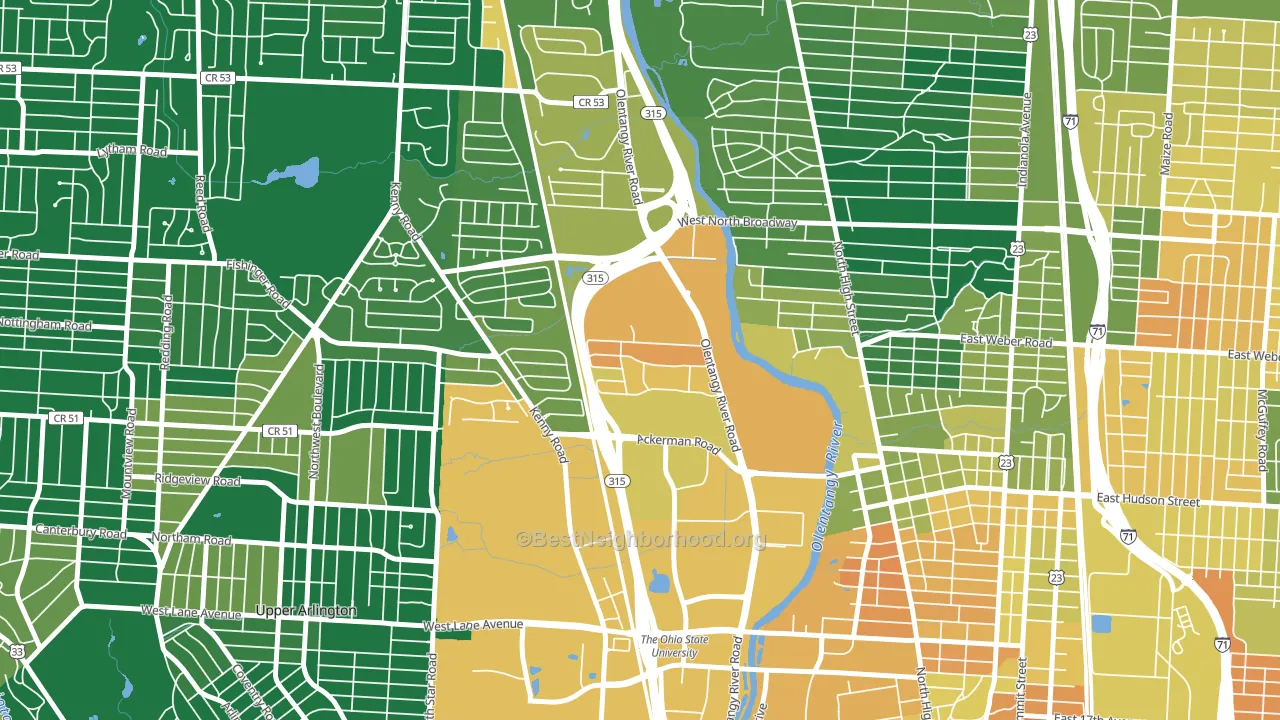
Olentangy River Road leans heavily Democratic by roughly 34 points: about 67% of voters vote Democratic and 33% Republican.
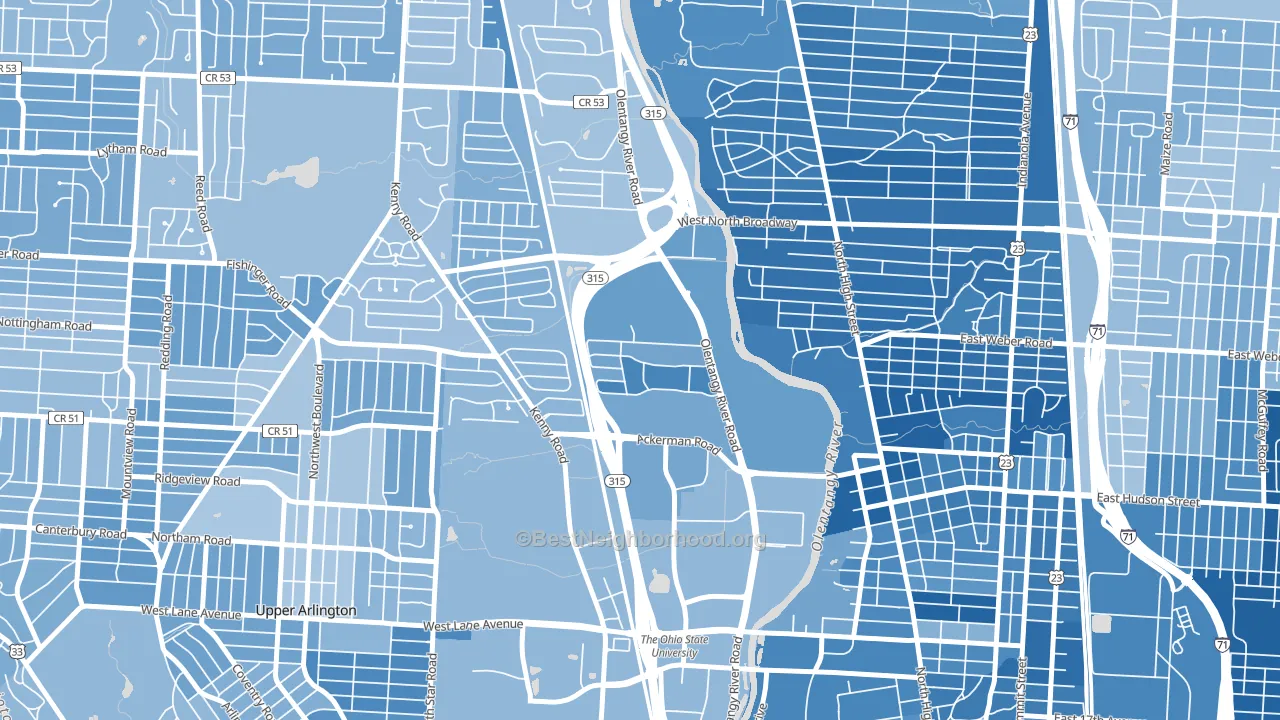
About 46% of adults in Olentangy River Road typically vote, below the U.S. average of about 62%. Among adults in Olentangy River Road, ~31% vote Democratic, ~15% Republican, and ~54% don't vote. The map below shows estimated turnout by block group.
How Olentangy River Road compares
Among neighborhoods within 5 miles, Olentangy River Road leans more Democratic than 2 of 17 neighbors.
Olentangy River Road runs about 45 points more Democratic than Ohio as a whole. Ohio leans Republican overall, while Olentangy River Road is one of the few Democratic-leaning pockets.
Why Olentangy River Road leans the way it does
This analysis examined 14,881 data points per neighborhood to find what predicts political lean and turnout. The items below are a few correlations that stood out for Olentangy River Road, not a ranked or complete list of what matters most.
Areas with high college attainment vote Democratic. About 58% of adults in Olentangy River Road hold a bachelor's degree, about 29 points above the U.S. average of 28%. A high never-married share predicts Democratic voting, and about 61% of adults in Olentangy River Road have never been married, above 94% of neighborhoods. Olentangy River Road runs against the grain of Ohio, a Democratic-leaning pocket in a Republican-leaning state.
Population density and Democratic lean
Places with high population density tend to lean Democratic; Olentangy River Road, Columbus, OH sits in the top quarter nationally on this measure.
Why turnout in Olentangy River Road looks the way it does
Renters vote less often than owners. About 88% of households in Olentangy River Road rent, about 63 points above the U.S. average of 25%. Crowded housing lines up with lower turnout, and about 8% of homes in Olentangy River Road have more than one occupant per room, above 88% of neighborhoods. Learn more about the findings and methodology on the political spectrum map.
Nearby Neighborhoods
- Clintonville, Columbus, OH D+58
- University, Columbus, OH D+56
- Tri-Village, Columbus, OH D+48
- Fifth by Northwest, Columbus, OH D+48
- Weinland Park, Columbus, OH D+61
- North Linden, Columbus, OH D+37
- South Linden, Columbus, OH D+75
- Harrison West, Columbus, OH D+54
- Victorian Village, Columbus, OH D+60
- Italian Village, Columbus, OH D+53
Neighborhoods with Similar Populations
- East Village, Amherst, MA D+74
- Terra Vista, Bakersfield, CA R+7
- Millside Heights, Riverside, NJ D+9
- Centennial Park, Santa Ana, CA D+24
- Chimney Rock Area, Abilene, TX R+46
- Fairfax, Colorado Springs, CO R+16
- North El Monte, Arcadia, CA D+13
- Fairoaks, Tampa, FL R+2
- East del Paso Heights, Sacramento, CA D+20
- Columbus Park, Omaha, NE D+36
Sources and methodology
Precinct-level voting records used to fit the model come from Ohio Secretary of State, Elections, distributed by the Voting and Election Science Team. Demographic inputs come from the U.S. Census Bureau (ACS 5-year estimates and the 2020 Decennial Census). Health and environmental inputs come from the CDC (PLACES and the Environmental Justice Index). Land cover comes from the USGS and EPA. Election-day and lead-up weather come from PRISM 4km daily grids and the NOAA Global Historical Climatology Network. Mail-voting and election-administration patterns come from the MIT Election Lab's Survey of the Performance of American Elections. Block-group crime detail comes from CrimeGrade. Internet data and modeling support provided by ISPreports.org.
Modeling and analysis by the BestNeighborhood data science team. Full methodology and findings: political spectrum map.
Methodology reviewed by the BestNeighborhood data team. Last updated May 2026.