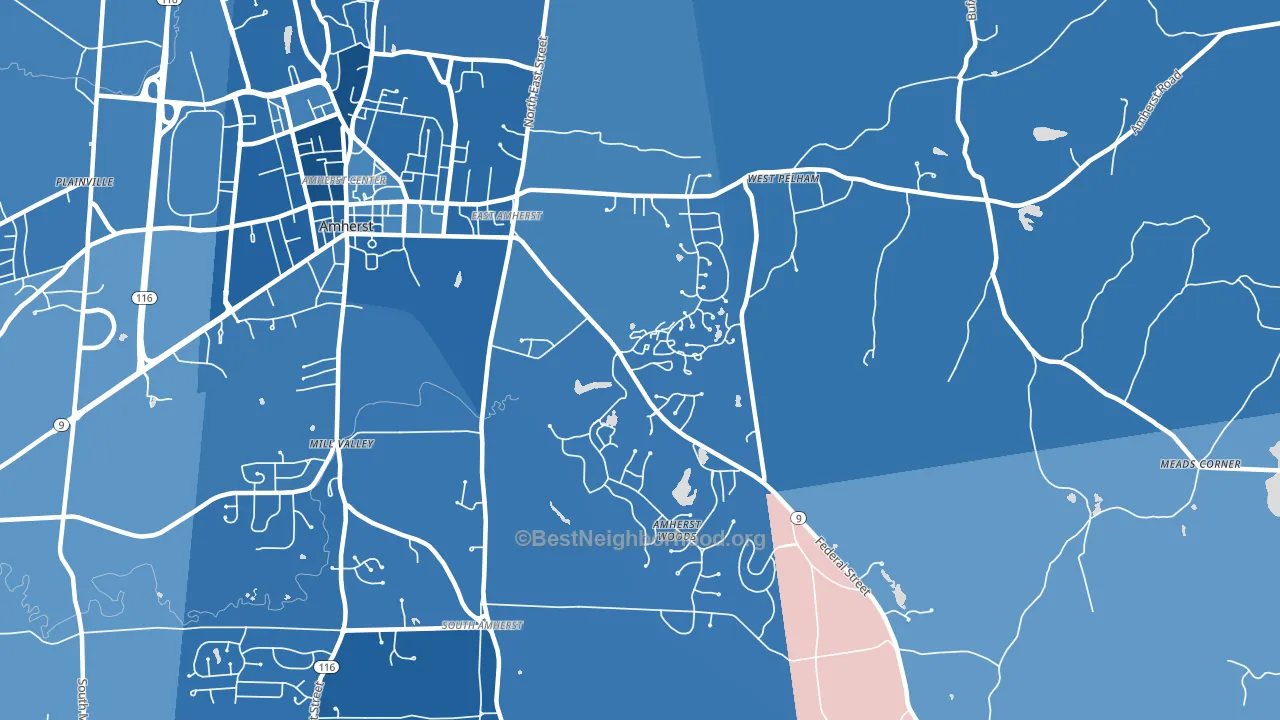
East Village is a Democratic stronghold. About 87% of voters here vote Democratic and 13% Republican.
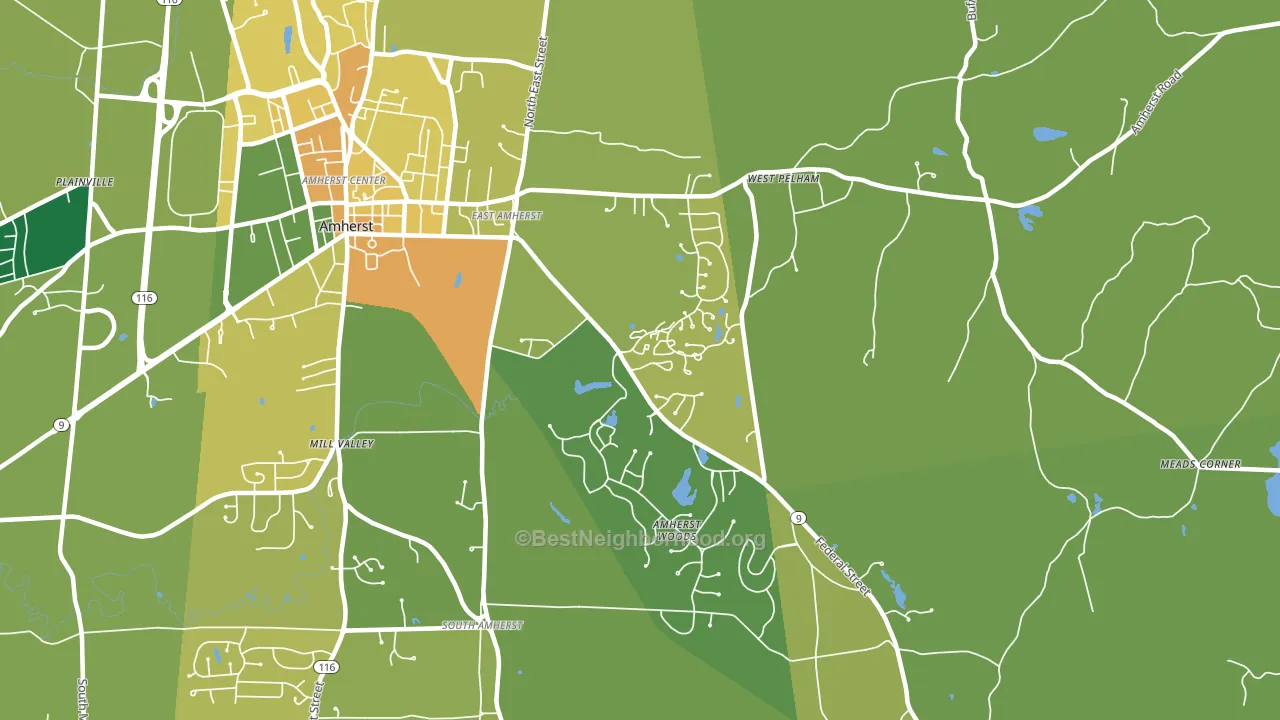
About 74% of adults in East Village typically vote, above the U.S. average of about 62%. Among adults in East Village, ~64% vote Democratic, ~10% Republican, and ~26% don't vote. The map below shows estimated turnout by block group.
How East Village compares
East Village sits in a sparsely populated area with few comparable neighborhoods nearby.
East Village runs about 49 points more Democratic than Massachusetts as a whole.
Why East Village leans the way it does
This analysis examined 14,881 data points per neighborhood to find what predicts political lean and turnout. The items below are a few correlations that stood out for East Village, not a ranked or complete list of what matters most.
Areas with high college attainment vote Democratic. About 79% of adults in East Village hold a bachelor's degree, about 51 points above the U.S. average of 28%.
High-school completion, developed land, and voter turnout
Places that combine high-school-completion-heavy adults and a rural land-use pattern tend to turn out at a higher rate, as East Village, Amherst, MA does.
Why turnout in East Village looks the way it does
Areas with strong routine healthcare access turn out at higher rates. East Village is in the top quarter nationally for routine-care measures such as insurance coverage, preventive screenings, and dental visits. The dental-visit rate here is about 73%, about 13 points above the U.S. average of 60%. High high-school completion lines up with higher turnout, and about 98% of adults in East Village have completed high school, above 86% of neighborhoods. Learn more about the findings and methodology on the political spectrum map.
Nearby Neighborhoods
- South Amherst, Amherst, MA D+71
- North Amherst, Amherst, MA D+75
- Boston Road, Springfield, MA D+24
- East Springfield, Springfield, MA D+19
- Pine Point, Springfield, MA D+41
- Liberty Heights, Springfield, MA D+34
- Bay, Springfield, MA D+56
- Sixteen Acres, Springfield, MA D+20
- McKnight, Springfield, MA D+55
- Upper Hill, Springfield, MA D+65
Neighborhoods with Similar Populations
- Millside Heights, Riverside, NJ D+9
- Terra Vista, Bakersfield, CA R+7
- Olentangy River Road, Columbus, OH D+34
- Centennial Park, Santa Ana, CA D+24
- North El Monte, Arcadia, CA D+13
- Arroyo Viejo, Oakland, CA D+66
- East del Paso Heights, Sacramento, CA D+20
- Columbus Park, Omaha, NE D+36
- Fairoaks, Tampa, FL R+2
- Fairfax, Colorado Springs, CO R+16
Sources and methodology
Precinct-level voting records used to fit the model come from Massachusetts Secretary of the Commonwealth, Elections, distributed by the Voting and Election Science Team. Demographic inputs come from the U.S. Census Bureau (ACS 5-year estimates and the 2020 Decennial Census). Health and environmental inputs come from the CDC (PLACES and the Environmental Justice Index). Land cover comes from the USGS and EPA. Election-day and lead-up weather come from PRISM 4km daily grids and the NOAA Global Historical Climatology Network. Mail-voting and election-administration patterns come from the MIT Election Lab's Survey of the Performance of American Elections. Block-group crime detail comes from CrimeGrade. Internet data and modeling support provided by ISPreports.org.
Modeling and analysis by the BestNeighborhood data science team. Full methodology and findings: political spectrum map.
Methodology reviewed by the BestNeighborhood data team. Last updated May 2026.