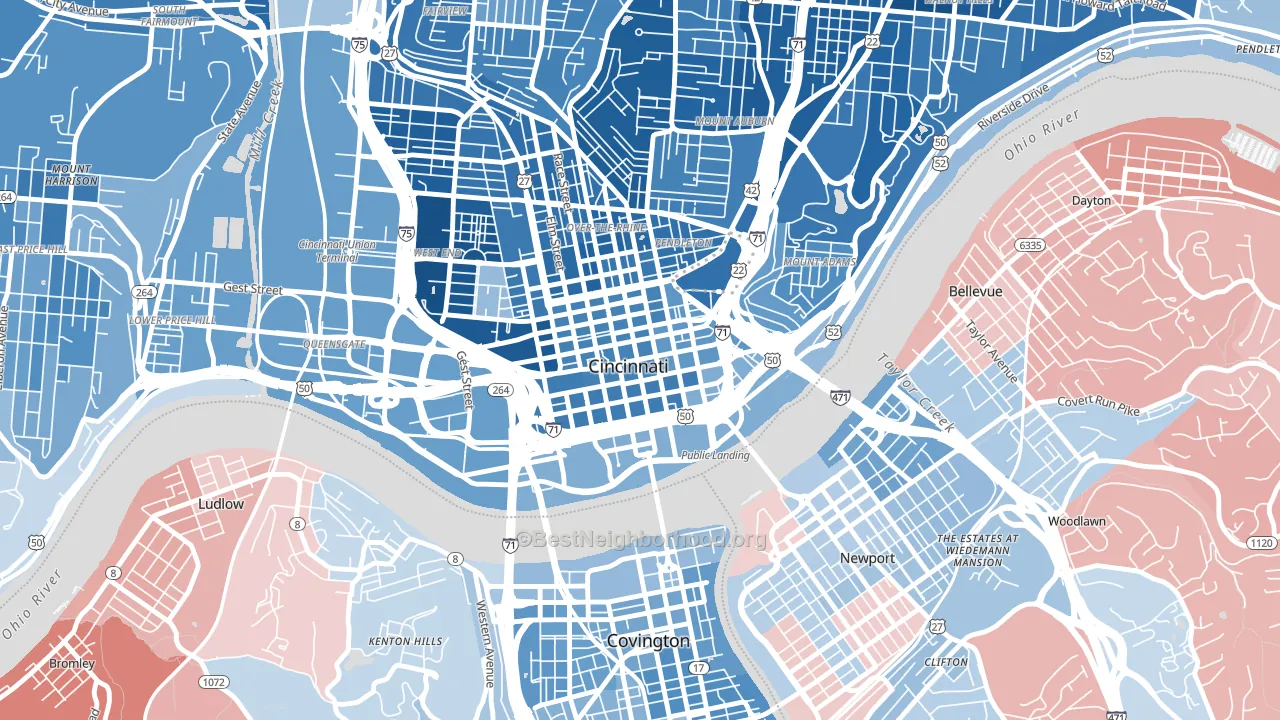
Central Business District is a Democratic stronghold. About 76% of voters here vote Democratic and 24% Republican.
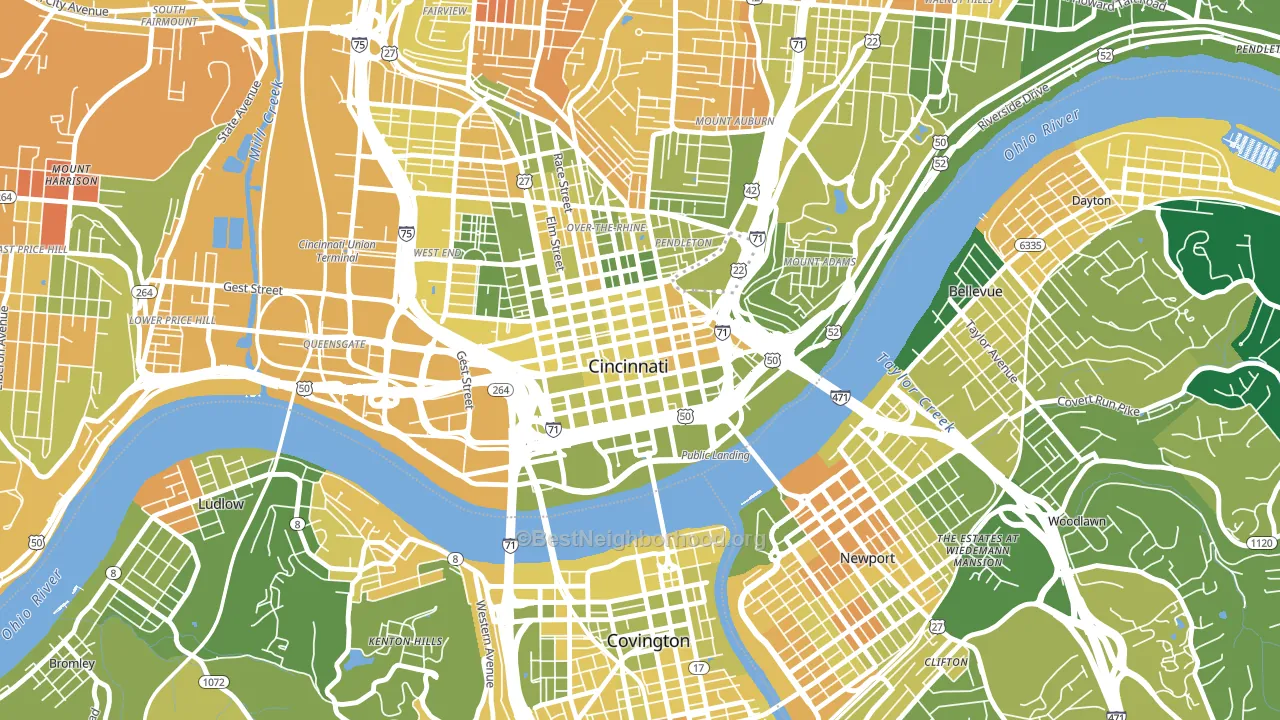
About 57% of adults in Central Business District typically vote, near the U.S. average of about 62%. Among adults in Central Business District, ~43% vote Democratic, ~14% Republican, and ~43% don't vote. The map below shows estimated turnout by block group.
How Central Business District compares
Among neighborhoods within 5 miles, Central Business District leans more Democratic than 5 of 18 neighbors.
Central Business District runs about 63 points more Democratic than Ohio as a whole. Ohio leans Republican overall, while Central Business District is one of the few Democratic-leaning pockets.
Politics vary noticeably by block within Central Business District. The southwest side is the most Democratic-leaning (D+56) and the southeast side is the least Democratic-leaning (D+40), a spread of about 15 points.
Why Central Business District leans the way it does
This analysis examined 14,881 data points per neighborhood to find what predicts political lean and turnout. The items below are a few correlations that stood out for Central Business District, not a ranked or complete list of what matters most.
Central Business District votes against the grain of Ohio. Ohio leans Republican overall, while Central Business District runs about 63 points more Democratic. High college attainment predicts Democratic voting, and Central Business District sits in the top quarter (about 66%, above 87% of neighborhoods). A high never-married share predicts Democratic voting, and about 65% of adults in Central Business District have never been married, above 96% of neighborhoods.
Walkability and Democratic lean
Places with a highly walkable street grid tend to lean Democratic; Central Business District, Cincinnati, OH sits in the top tenth nationally on this measure. A walkable street grid does not change how people vote; it mostly reflects how urban a place is.
Why turnout in Central Business District looks the way it does
Renters vote less often than owners. About 88% of households in Central Business District rent, about 63 points above the U.S. average of 25%. Learn more about the findings and methodology on the political spectrum map.
Nearby Neighborhoods
- Over-the-Rhine, Cincinnati, OH D+68
- West End, Cincinnati, OH D+75
- Mount Auburn, Cincinnati, OH D+67
- Cuf, Cincinnati, OH D+54
- Walnut Hills, Cincinnati, OH D+74
- Corryville, Cincinnati, OH D+54
- Wallace Woods, Covington, KY D+13
- East Price Hill, Cincinnati, OH D+36
- Avondale, Cincinnati, OH D+83
- Clifton, Cincinnati, OH D+68
Neighborhoods with Similar Populations
- Forest Park, Baltimore, MD D+86
- Michigan-Martin, Detroit, MI D+36
- Fairwood Greens, Fairwood, WA D+31
- Glenham-Belhar, Baltimore, MD D+74
- Old City-Produce and Waterfront, Oakland, CA D+60
- Bivins Addition, Amarillo, TX R+18
- Schoolcraft Southfield, Detroit, MI D+88
- West Village, Oxnard, CA D+29
- Coral Ridge Country Club Estates, Fort Lauderdale, FL R+12
- Waller, Tacoma, WA R+4
Sources and methodology
Precinct-level voting records used to fit the model come from Ohio Secretary of State, Elections, distributed by the Voting and Election Science Team. Demographic inputs come from the U.S. Census Bureau (ACS 5-year estimates and the 2020 Decennial Census). Health and environmental inputs come from the CDC (PLACES and the Environmental Justice Index). Land cover comes from the USGS and EPA. Election-day and lead-up weather come from PRISM 4km daily grids and the NOAA Global Historical Climatology Network. Mail-voting and election-administration patterns come from the MIT Election Lab's Survey of the Performance of American Elections. Block-group crime detail comes from CrimeGrade. Internet data and modeling support provided by ISPreports.org.
Modeling and analysis by the BestNeighborhood data science team. Full methodology and findings: political spectrum map.
Methodology reviewed by the BestNeighborhood data team. Last updated May 2026.