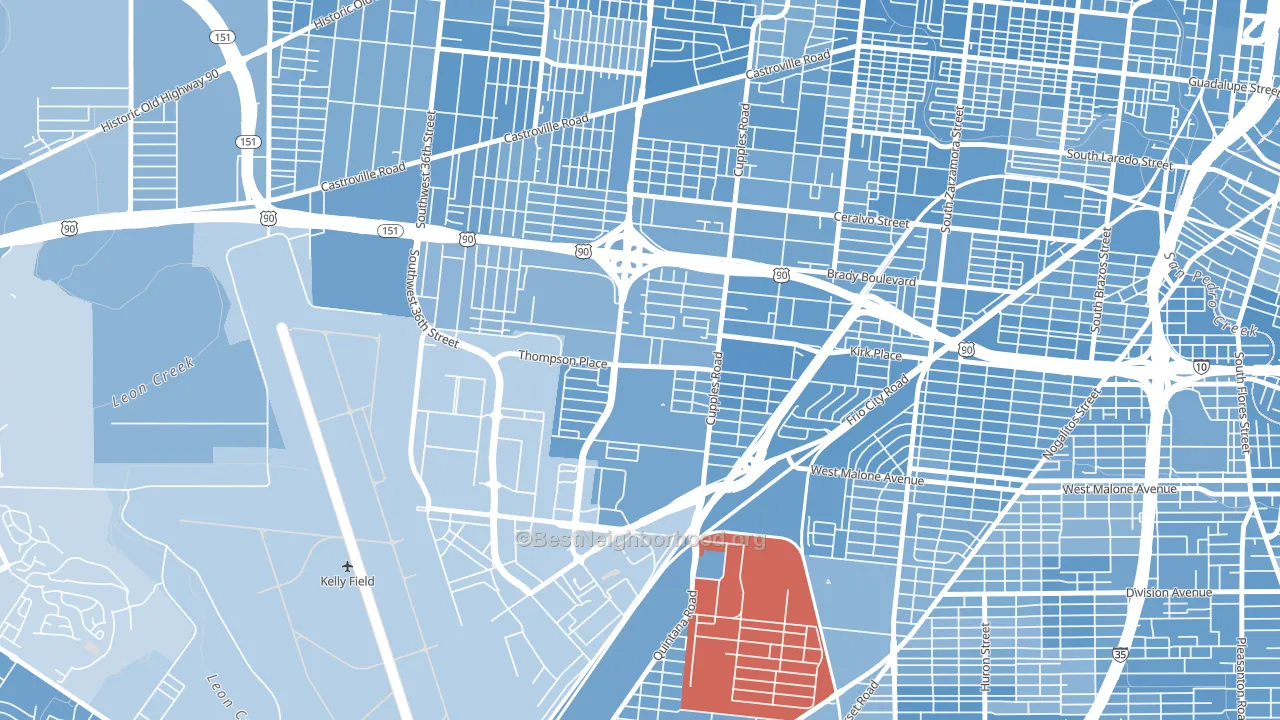
Thompson Community leans heavily Democratic by roughly 34 points: about 67% of voters vote Democratic and 33% Republican.
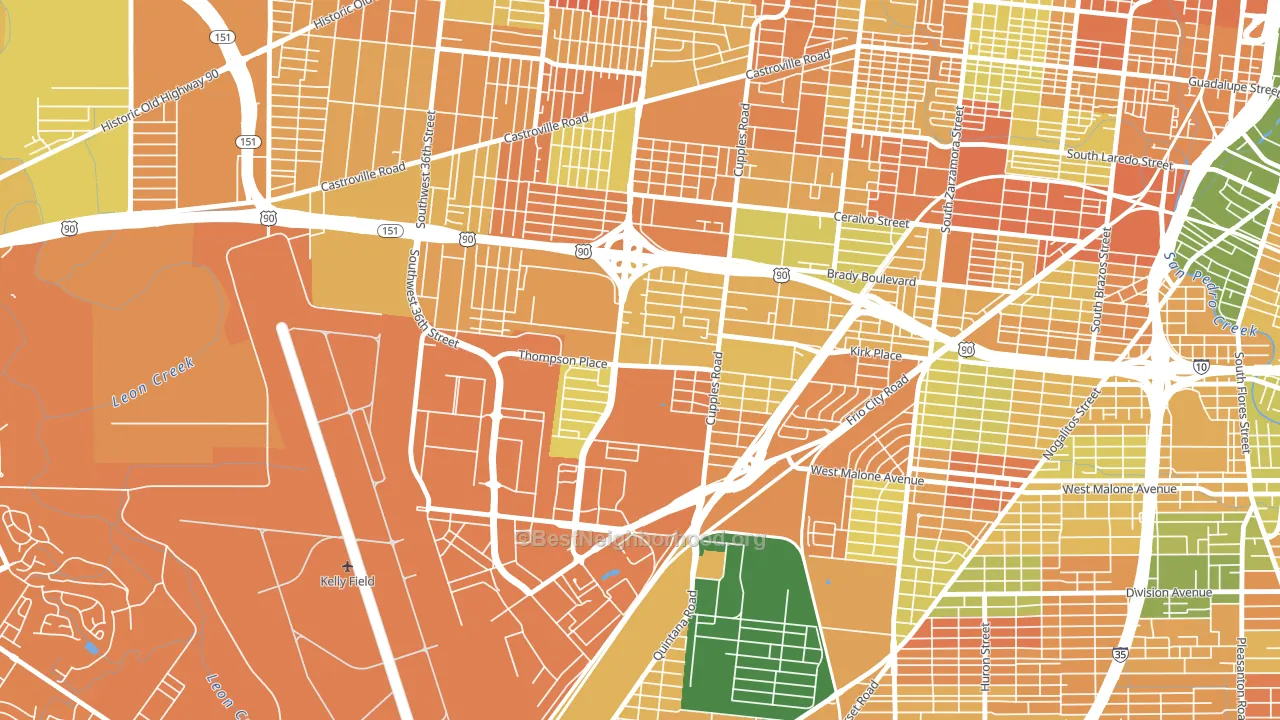
About 37% of adults in Thompson Community typically vote, below the U.S. average of about 62%. Among adults in Thompson Community, ~25% vote Democratic, ~12% Republican, and ~63% don't vote. The map below shows estimated turnout by block group.
How Thompson Community compares
Among neighborhoods within 5 miles, Thompson Community leans more Democratic than 16 of 30 neighbors.
Thompson Community runs about 47 points more Democratic than Texas as a whole. Texas leans Republican overall, while Thompson Community is one of the few Democratic-leaning pockets.
Why Thompson Community leans the way it does
This analysis examined 14,881 data points per neighborhood to find what predicts political lean and turnout. The items below are a few correlations that stood out for Thompson Community, not a ranked or complete list of what matters most.
Dense areas vote Democratic. More than 99% of residents in Thompson Community live in densely developed areas, about 64 points above the U.S. average of 36%. Thompson Community runs against the grain of Texas, a Democratic-leaning pocket in a Republican-leaning state.
High-school completion, developed land, and voter turnout
Places that combine low high-school-completion share and a heavily developed built environment tend to turn out at a lower rate, as Thompson Community, San Antonio, TX does.
Why turnout in Thompson Community looks the way it does
Areas with limited routine healthcare access turn out at lower rates. Thompson Community is in the bottom quarter nationally for routine-care measures such as insurance coverage, preventive screenings, and dental visits. The dental-visit rate here is about 36%, about 18 points below the Texas average of 54%. Low high-school completion lines up with lower turnout, and about 67% of adults in Thompson Community have completed high school, below 96% of neighborhoods. High-crime urban areas turn out at lower rates, and Thompson Community sits in the top 15% on a violent-crime measure. Learn more about the findings and methodology on the political spectrum map.
Nearby Neighborhoods
- Greater Gardendale, San Antonio, TX D+29
- Brady Gardens, San Antonio, TX D+34
- Las Palmas, San Antonio, TX D+35
- Quintana Community, San Antonio, TX D+35
- Los Jardines, San Antonio, TX D+32
- Palm Heights, San Antonio, TX D+33
- Collins Gardens, San Antonio, TX D+36
- Columbia Heights, San Antonio, TX D+33
- Avenida Guadalupe, San Antonio, TX D+37
- Community Workers Council, San Antonio, TX D+27
Neighborhoods with Similar Populations
- N Albuquerque Acres, Albuquerque, NM Even
- Cobble Hill, Brooklyn, NY D+79
- North River, Toledo, OH D+44
- Lankershim, Highland, CA D+22
- Sundance, Buckeye, AZ R+8
- Ardenwood, Fremont, CA D+36
- Crossroads, Highland, CA R+5
- Foster-Powell, Portland, OR D+63
- Northeast Hazel Dell, Hazel Dell, WA D+18
- Hill East, Washington, DC D+80
Sources and methodology
Precinct-level voting records used to fit the model come from Texas Secretary of State, Elections Division, distributed by the Voting and Election Science Team. Demographic inputs come from the U.S. Census Bureau (ACS 5-year estimates and the 2020 Decennial Census). Health and environmental inputs come from the CDC (PLACES and the Environmental Justice Index). Land cover comes from the USGS and EPA. Election-day and lead-up weather come from PRISM 4km daily grids and the NOAA Global Historical Climatology Network. Mail-voting and election-administration patterns come from the MIT Election Lab's Survey of the Performance of American Elections. Block-group crime detail comes from CrimeGrade. Internet data and modeling support provided by ISPreports.org.
Modeling and analysis by the BestNeighborhood data science team. Full methodology and findings: political spectrum map.
Methodology reviewed by the BestNeighborhood data team. Last updated May 2026.