Colonicaltown North leans heavily Democratic by roughly 40 points: about 70% of voters vote Democratic and 30% Republican.
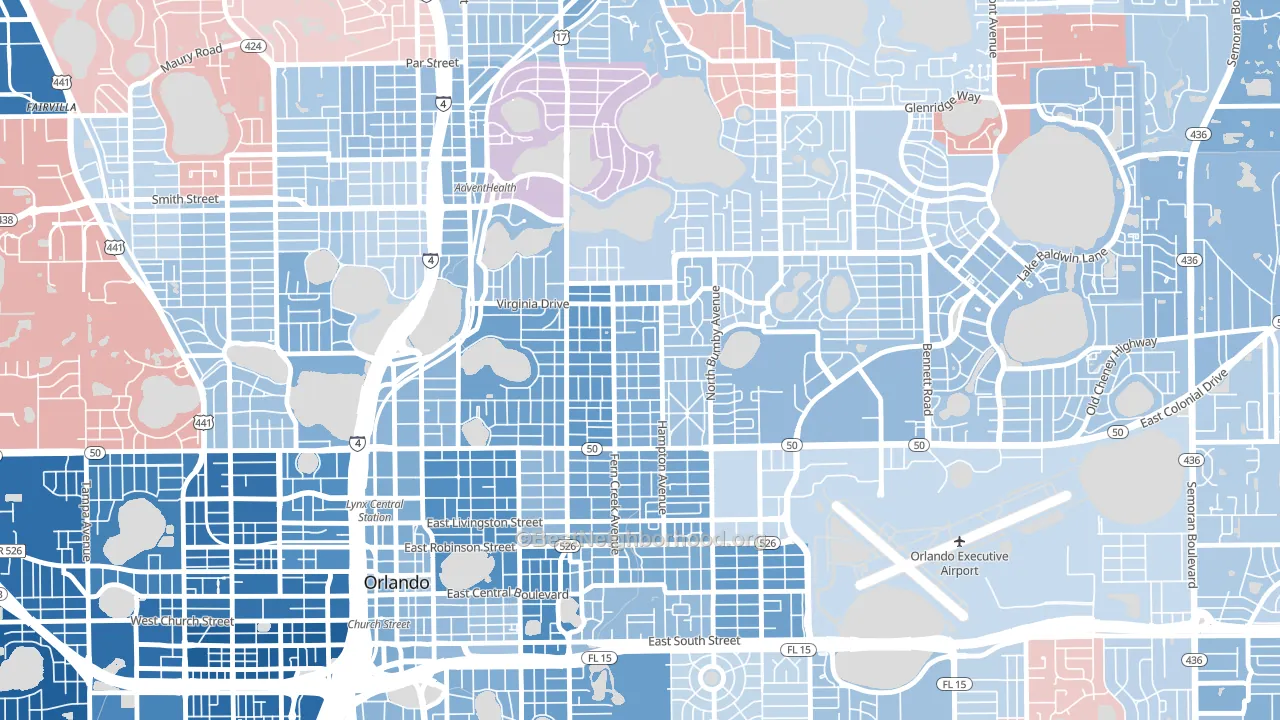
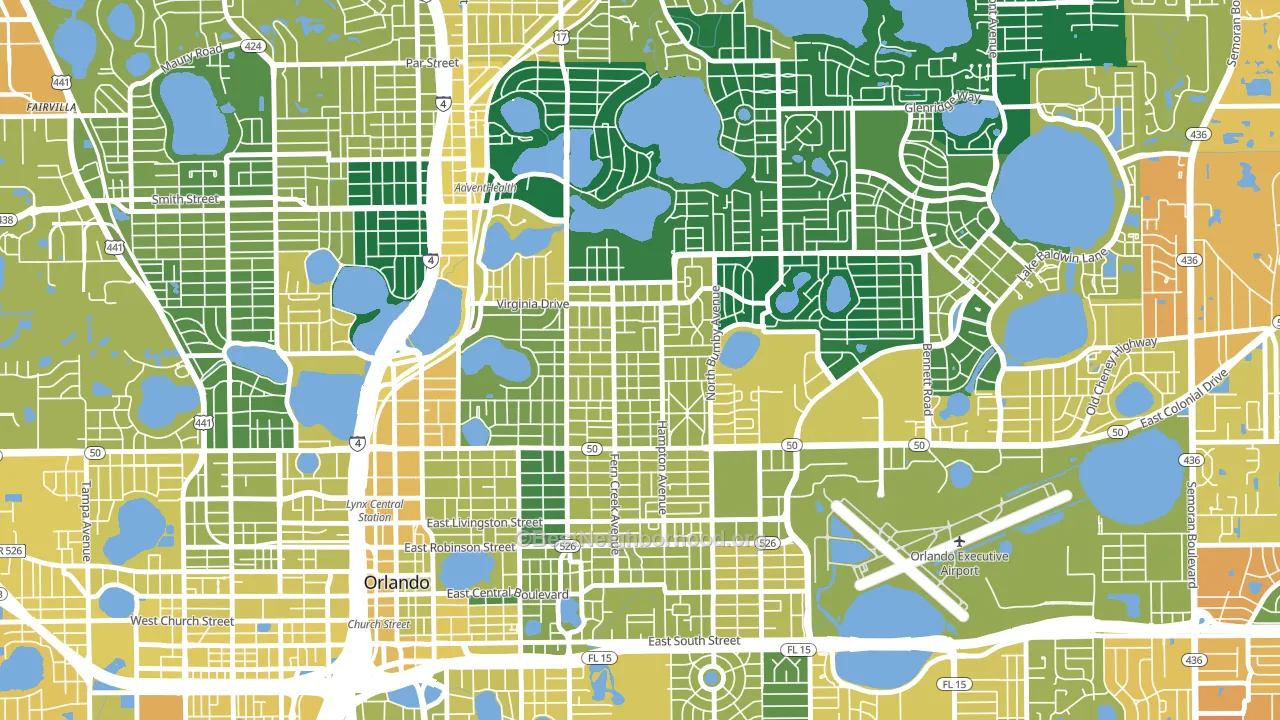
About 68% of adults in Colonicaltown North typically vote, above the U.S. average of about 62%. Among adults in Colonicaltown North, ~48% vote Democratic, ~20% Republican, and ~32% don't vote. The map below shows estimated turnout by block group.
How Colonicaltown North compares
Among neighborhoods within 5 miles, Colonicaltown North leans more Democratic than 13 of 16 neighbors.
Colonicaltown North runs about 52 points more Democratic than Florida as a whole. Florida leans Republican overall, while Colonicaltown North is one of the few Democratic-leaning pockets.
Why Colonicaltown North leans the way it does
This analysis examined 14,881 data points per neighborhood to find what predicts political lean and turnout. The items below are a few correlations that stood out for Colonicaltown North, not a ranked or complete list of what matters most.
Colonicaltown North votes against the grain of Florida. Florida leans Republican overall, while Colonicaltown North runs about 52 points more Democratic. High college attainment predicts Democratic voting, and Colonicaltown North sits in the top quarter (about 60%, above 81% of neighborhoods). A high never-married share predicts Democratic voting, and about 50% of adults in Colonicaltown North have never been married, above 81% of neighborhoods.
Walkability and Democratic lean
Places with a highly walkable street grid tend to lean Democratic; Colonicaltown North, Orlando, FL sits in the top tenth nationally on this measure. A walkable street grid does not change how people vote; it mostly reflects how urban a place is.
Why turnout in Colonicaltown North looks the way it does
Areas with high high-school completion turn out at higher rates. About 98% of adults in Colonicaltown North have completed high school, about 9 points above the Florida average of 89%. Learn more about the findings and methodology on the political spectrum map.
Nearby Neighborhoods
- Central Business District, Orlando, FL D+30
- North Orange, Orlando, FL D+15
- Baldwin Park, Orlando, FL D+10
- College Park, Orlando, FL D+14
- Holden-Parramore, Orlando, FL D+71
- Wadeview Park, Orlando, FL D+15
- South Orange, Orlando, FL D+17
- Hibiscus, Azalea Park, FL D+10
- Mariners Village, Orlando, FL D+5
- Englewood Park, Orlando, FL D+17
Neighborhoods with Similar Populations
- Skyland Park, Mobile, AL R+27
- Bloomingdale, Fort Wayne, IN D+3
- Bramalea, Boca Raton, FL Even
- Santa Fe, Laredo, TX R+8
- Parkview, Oklahoma City, OK D+25
- Central Ave, Albany, NY D+66
- Rattlesnake, Tampa, FL R+3
- Gorgas, Mobile, AL D+90
- Oakwell Farms, San Antonio, TX D+18
- Palm Club Village, West Palm Beach, FL D+24
Sources and methodology
Precinct-level voting records used to fit the model come from Florida Division of Elections, distributed by the Voting and Election Science Team. Demographic inputs come from the U.S. Census Bureau (ACS 5-year estimates and the 2020 Decennial Census). Health and environmental inputs come from the CDC (PLACES and the Environmental Justice Index). Land cover comes from the USGS and EPA. Election-day and lead-up weather come from PRISM 4km daily grids and the NOAA Global Historical Climatology Network. Mail-voting and election-administration patterns come from the MIT Election Lab's Survey of the Performance of American Elections. Block-group crime detail comes from CrimeGrade. Internet data and modeling support provided by ISPreports.org.
Modeling and analysis by the BestNeighborhood data science team. Full methodology and findings: political spectrum map.
Methodology reviewed by the BestNeighborhood data team. Last updated May 2026.