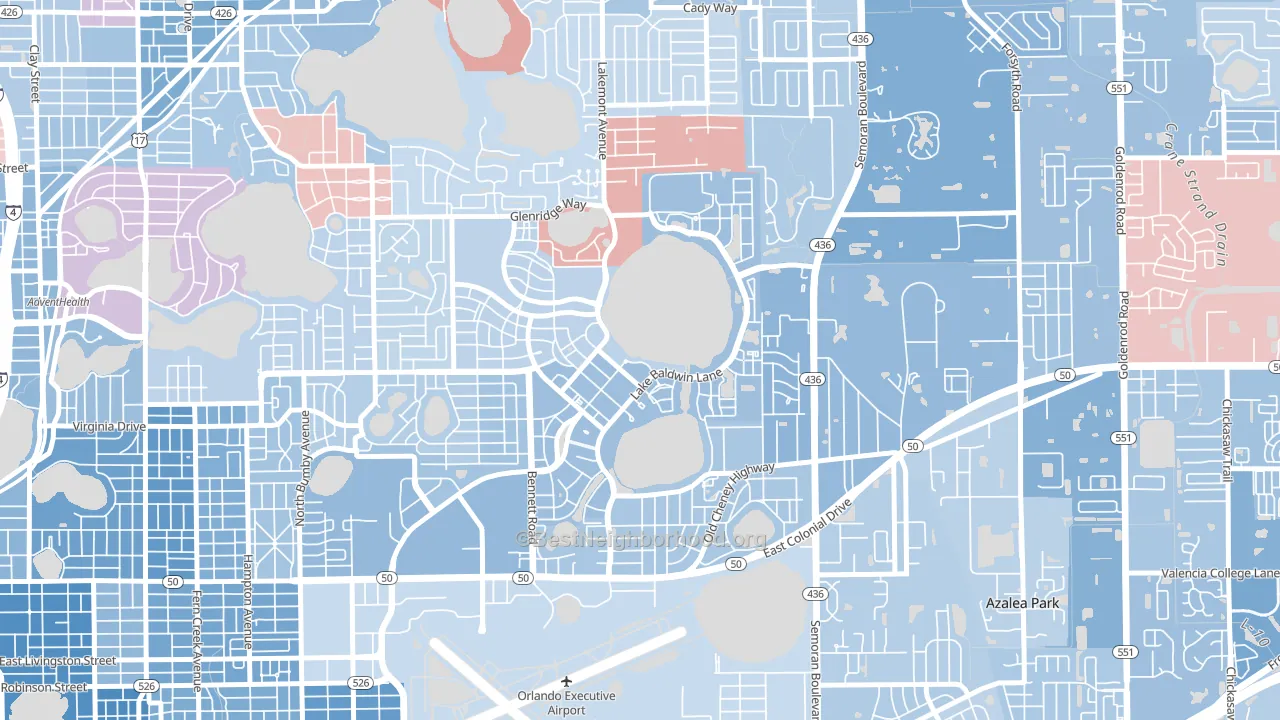
Baldwin Park leans slightly Democratic by roughly 10 points: about 55% of voters vote Democratic and 45% Republican.
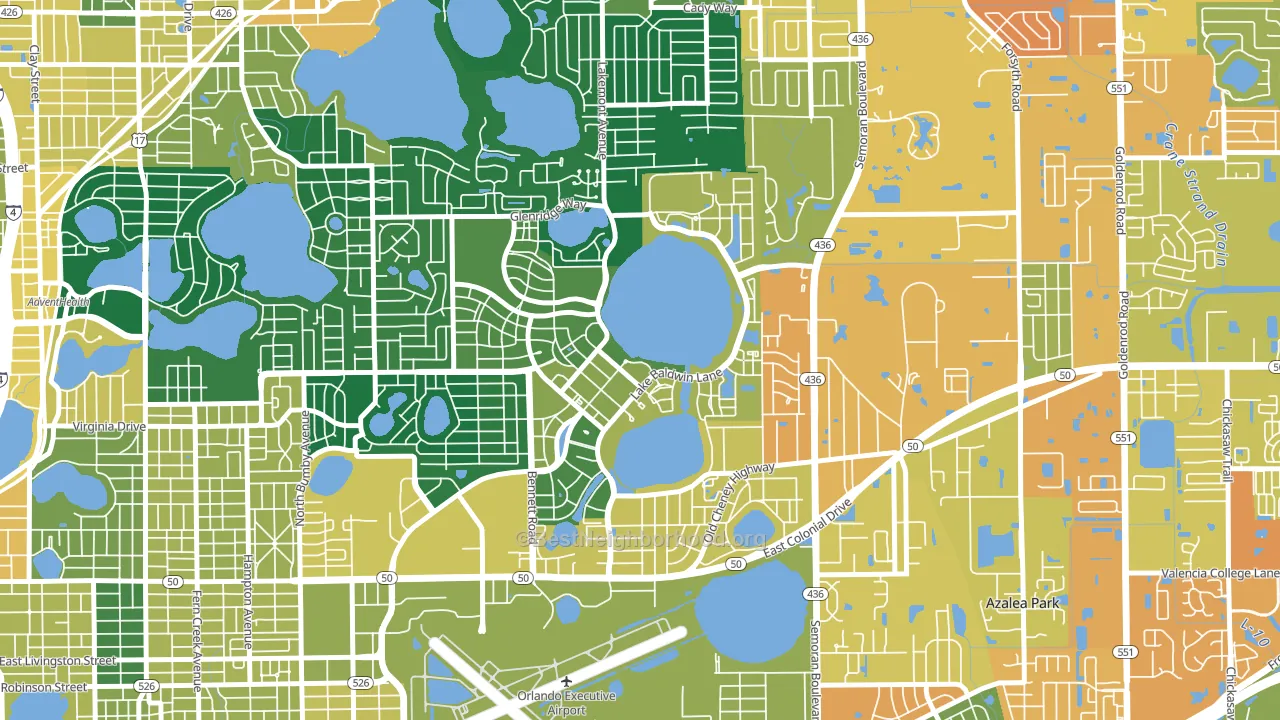
About 70% of adults in Baldwin Park typically vote, above the U.S. average of about 62%. Among adults in Baldwin Park, ~39% vote Democratic, ~32% Republican, and ~29% don't vote. The map below shows estimated turnout by block group.
How Baldwin Park compares
Among neighborhoods within 5 miles, Baldwin Park leans more Democratic than 3 of 15 neighbors.
Baldwin Park runs about 23 points more Democratic than Florida as a whole. Florida leans Republican overall, while Baldwin Park is one of the few Democratic-leaning pockets.
Politics vary noticeably by block within Baldwin Park. The southeast side is the most Democratic-leaning (D+21) and the north side is the least Democratic-leaning (Even), a spread of about 20 points.
Why Baldwin Park leans the way it does
This analysis examined 14,881 data points per neighborhood to find what predicts political lean and turnout. The items below are a few correlations that stood out for Baldwin Park, not a ranked or complete list of what matters most.
Areas with high college attainment vote Democratic. About 68% of adults in Baldwin Park hold a bachelor's degree, about 39 points above the U.S. average of 28%. Baldwin Park runs against the grain of Florida, a Democratic-leaning pocket in a Republican-leaning state.
Population density and Democratic lean
Places with high population density tend to lean Democratic; Baldwin Park, Orlando, FL sits in the top quarter nationally on this measure.
Why turnout in Baldwin Park looks the way it does
Areas with high high-school completion turn out at higher rates. About 98% of adults in Baldwin Park have completed high school, about 8 points above the Florida average of 89%. Learn more about the findings and methodology on the political spectrum map.
Nearby Neighborhoods
- Hibiscus, Azalea Park, FL D+10
- Colonicaltown North, Orlando, FL D+39
- Englewood Park, Orlando, FL D+17
- Woodlands-Orlando, Orlando, FL D+23
- North Orange, Orlando, FL D+15
- Central Business District, Orlando, FL D+30
- Mariners Village, Orlando, FL D+5
- Lake Frederica, Orlando, FL D+19
- College Park, Orlando, FL D+14
- Ventura, Orlando, FL D+11
Neighborhoods with Similar Populations
- Washington Park, Chicago, IL D+81
- Southside, Toledo, OH D+34
- Family Acres, Lincoln, NE Even
- St. Francis, Daly City, CA D+35
- Southwest, Wichita, KS Even
- Parkrose, Portland, OR D+35
- Atlantic Beaches, Atlantic Beach, FL R+15
- Denby, Detroit, MI D+85
- Riverside, Austin, TX D+49
- River Mountain, Little Rock, AR D+9
Sources and methodology
Precinct-level voting records used to fit the model come from Florida Division of Elections, distributed by the Voting and Election Science Team. Demographic inputs come from the U.S. Census Bureau (ACS 5-year estimates and the 2020 Decennial Census). Health and environmental inputs come from the CDC (PLACES and the Environmental Justice Index). Land cover comes from the USGS and EPA. Election-day and lead-up weather come from PRISM 4km daily grids and the NOAA Global Historical Climatology Network. Mail-voting and election-administration patterns come from the MIT Election Lab's Survey of the Performance of American Elections. Block-group crime detail comes from CrimeGrade. Internet data and modeling support provided by ISPreports.org.
Modeling and analysis by the BestNeighborhood data science team. Full methodology and findings: political spectrum map.
Methodology reviewed by the BestNeighborhood data team. Last updated May 2026.