Mariners Village is a true toss-up. About 52% of voters here vote Democratic and 48% Republican.
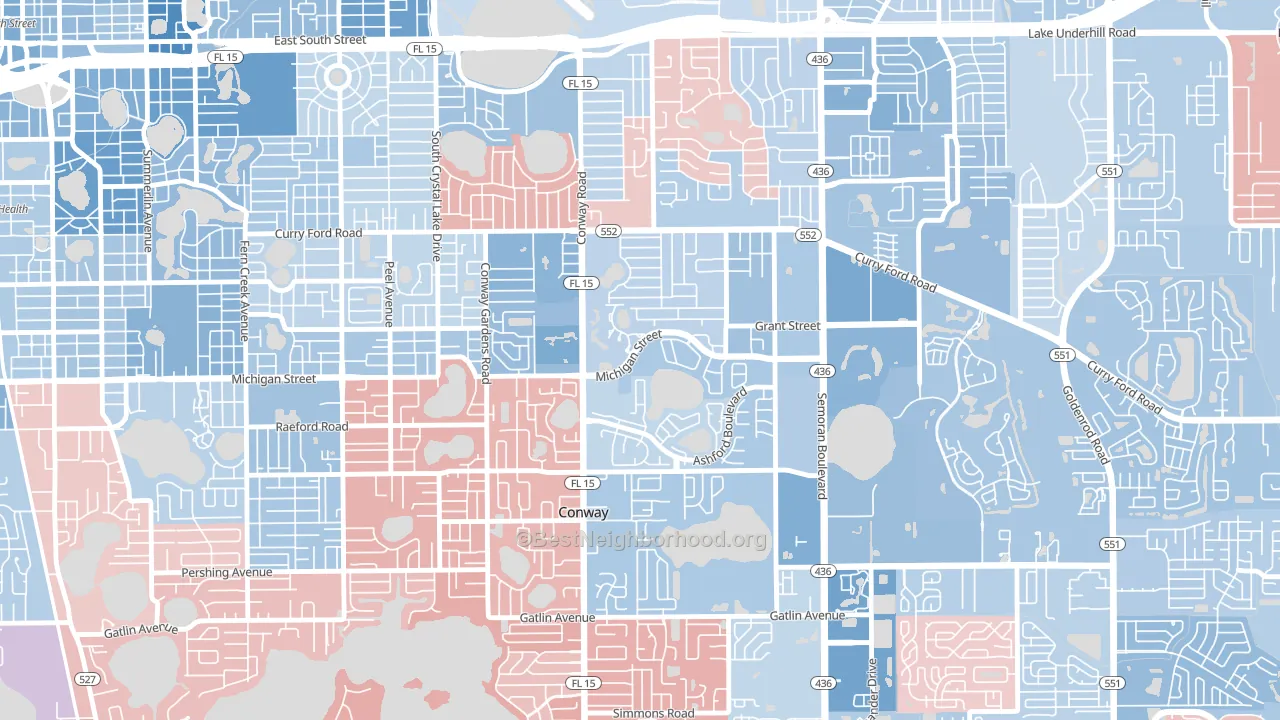
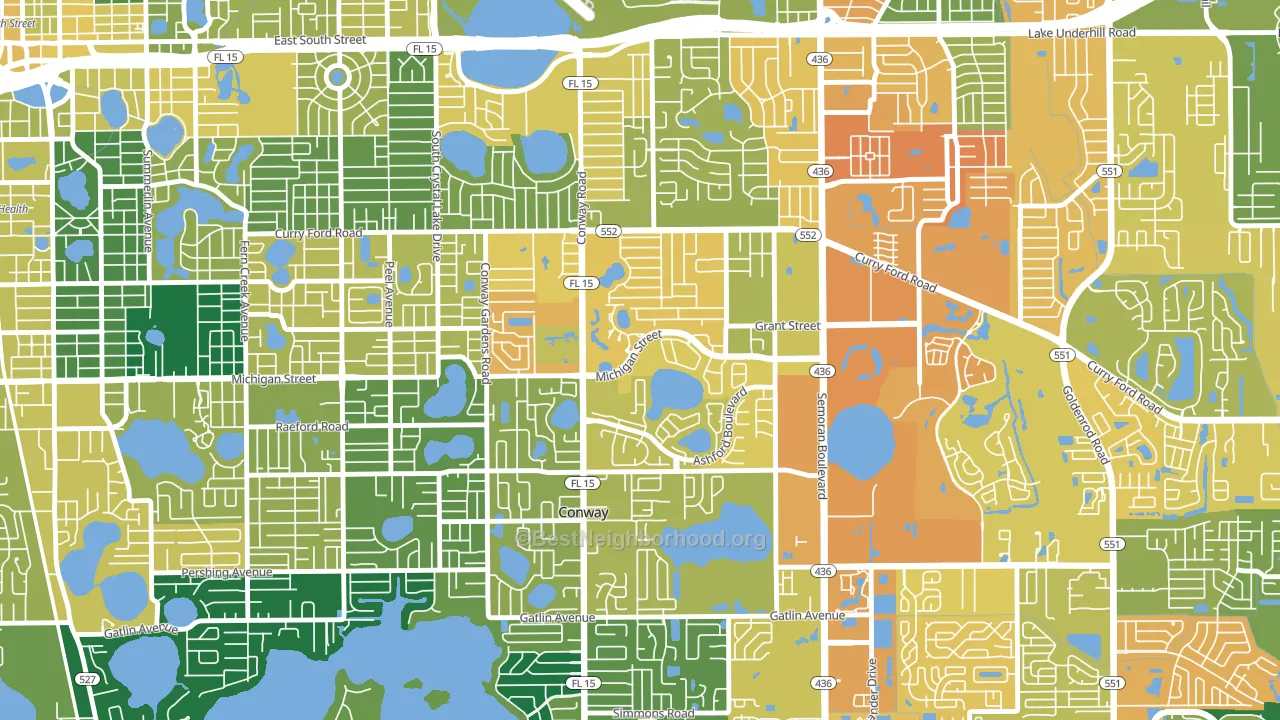
About 49% of adults in Mariners Village typically vote, below the U.S. average of about 62%. Among adults in Mariners Village, ~25% vote Democratic, ~24% Republican, and ~51% don't vote. The map below shows estimated turnout by block group.
How Mariners Village compares
Among neighborhoods within 5 miles, Mariners Village leans more Democratic than 2 of 16 neighbors.
Mariners Village runs about 18 points more Democratic than Florida as a whole. Florida leans Republican overall, while Mariners Village is one of the few Democratic-leaning pockets.
Why Mariners Village leans the way it does
This analysis examined 14,881 data points per neighborhood to find what predicts political lean and turnout. The items below are a few correlations that stood out for Mariners Village, not a ranked or complete list of what matters most.
Mariners Village votes against the grain of Florida. Florida leans Republican overall, while Mariners Village runs about 18 points more Democratic.
Preventive-care access and voter turnout
Places with limited routine preventive-care access tend to turn out at a lower rate; Mariners Village, Orlando, FL sits in the bottom quarter nationally on this measure. Dental visits do not drive turnout; the rate reflects income, insurance, and healthcare access, which line up with who votes.
Why turnout in Mariners Village looks the way it does
Areas with limited routine healthcare access turn out at lower rates. Mariners Village is in the bottom quarter nationally for routine-care measures such as insurance coverage, preventive screenings, and dental visits. The uninsured rate here is about 22%, about 7 points above the Florida average of 15%. Learn more about the findings and methodology on the political spectrum map.
Nearby Neighborhoods
- Conway, Orlando, FL R+4
- Lake Frederica, Orlando, FL D+19
- South Semoran, Orlando, FL D+13
- Ventura, Orlando, FL D+11
- Englewood Park, Orlando, FL D+17
- Wadeview Park, Orlando, FL D+15
- Hibiscus, Azalea Park, FL D+10
- South Orange, Orlando, FL D+17
- Airport North, Orlando, FL D+21
- Colonicaltown North, Orlando, FL D+39
Neighborhoods with Similar Populations
- Downtown Chandler, Chandler, AZ D+22
- Bayou Shore, Galveston, TX D+19
- Orchard Breeze, Wichita, KS R+7
- SW Jones, Wausau, WI Even
- Valverde, Denver, CO D+50
- Hawk's Landing, Verona, WI D+50
- Rankin Historic District, Ironton, OH R+24
- Eastmorland, Madison, WI D+71
- Lake Forest, Jacksonville, FL D+66
- Kinsmith, Cleveland, OH D+82
Sources and methodology
Precinct-level voting records used to fit the model come from Florida Division of Elections, distributed by the Voting and Election Science Team. Demographic inputs come from the U.S. Census Bureau (ACS 5-year estimates and the 2020 Decennial Census). Health and environmental inputs come from the CDC (PLACES and the Environmental Justice Index). Land cover comes from the USGS and EPA. Election-day and lead-up weather come from PRISM 4km daily grids and the NOAA Global Historical Climatology Network. Mail-voting and election-administration patterns come from the MIT Election Lab's Survey of the Performance of American Elections. Block-group crime detail comes from CrimeGrade. Internet data and modeling support provided by ISPreports.org.
Modeling and analysis by the BestNeighborhood data science team. Full methodology and findings: political spectrum map.
Methodology reviewed by the BestNeighborhood data team. Last updated May 2026.