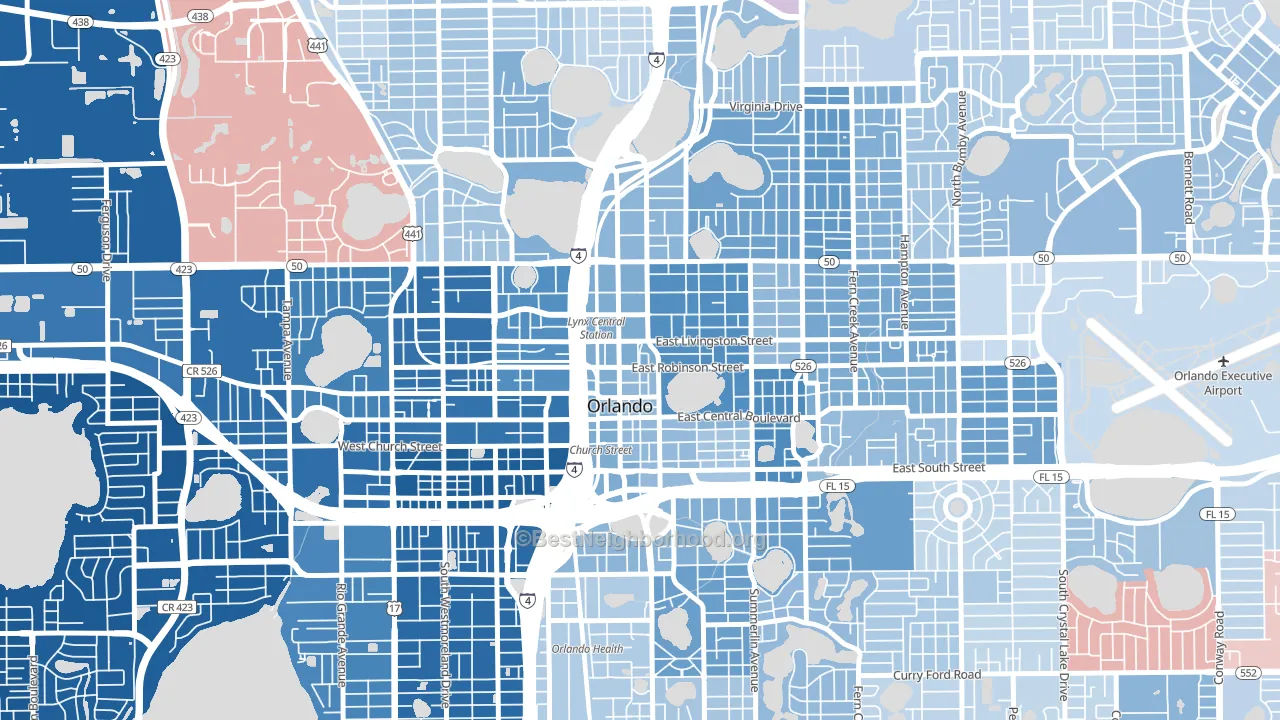
Central Business District leans heavily Democratic by roughly 30 points: about 65% of voters vote Democratic and 35% Republican.
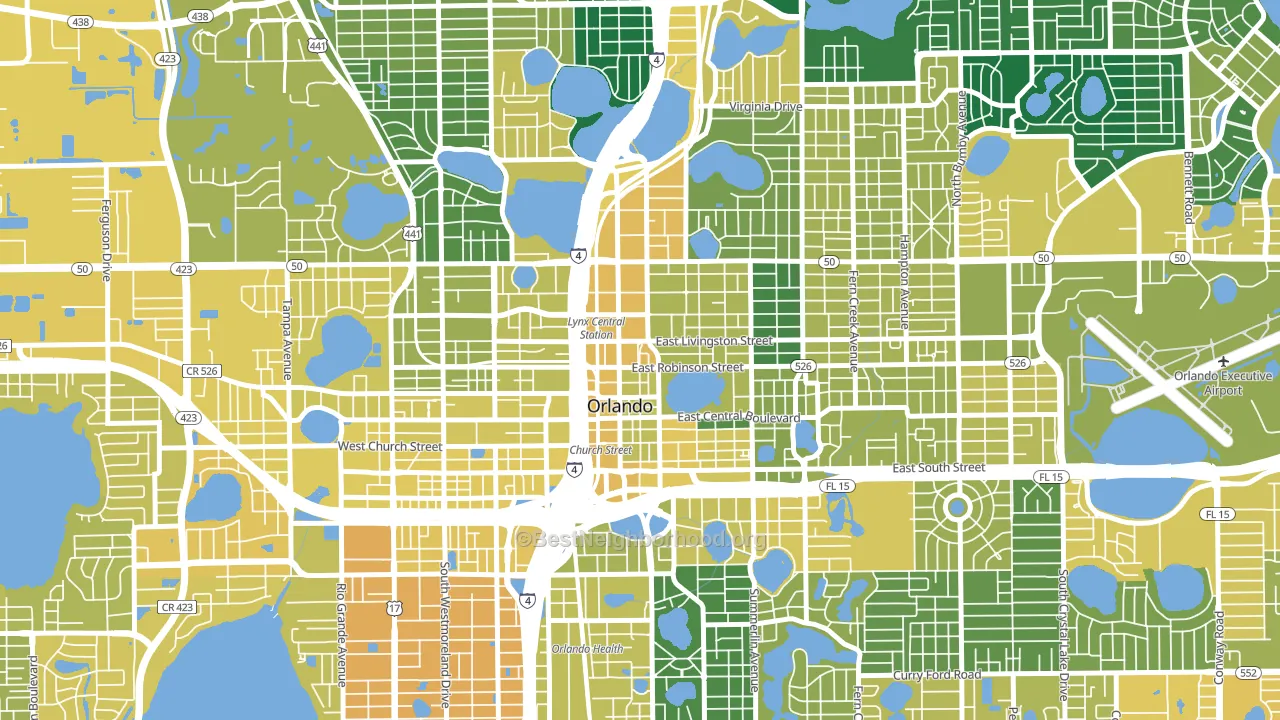
About 48% of adults in Central Business District typically vote, below the U.S. average of about 62%. Among adults in Central Business District, ~31% vote Democratic, ~17% Republican, and ~52% don't vote. The map below shows estimated turnout by block group.
How Central Business District compares
Among neighborhoods within 5 miles, Central Business District leans more Democratic than 11 of 20 neighbors.
Central Business District runs about 43 points more Democratic than Florida as a whole. Florida leans Republican overall, while Central Business District is one of the few Democratic-leaning pockets.
Politics vary noticeably by block within Central Business District. The south side is the most Democratic-leaning (D+34) and the northwest side is the least Democratic-leaning (D+20), a spread of about 14 points.
Why Central Business District leans the way it does
This analysis examined 14,881 data points per neighborhood to find what predicts political lean and turnout. The items below are a few correlations that stood out for Central Business District, not a ranked or complete list of what matters most.
Areas with high college attainment vote Democratic. About 66% of adults in Central Business District hold a bachelor's degree, about 37 points above the U.S. average of 28%. A high never-married share predicts Democratic voting, and about 59% of adults in Central Business District have never been married, above 92% of neighborhoods. Central Business District runs against the grain of Florida, a Democratic-leaning pocket in a Republican-leaning state.
Paved land cover and Democratic lean
Places with extensive paved surfaces tend to lean Democratic; Central Business District, Orlando, FL sits in the top tenth nationally on this measure. Paved ground does not change how people vote; it mostly reflects how urban and built-up a place is.
Why turnout in Central Business District looks the way it does
Renters vote less often than owners. About 73% of households in Central Business District rent, about 48 points above the U.S. average of 25%. High-crime urban areas turn out at lower rates, and Central Business District sits in the top 15% on a violent-crime measure. Learn more about the findings and methodology on the political spectrum map.
Nearby Neighborhoods
- Holden-Parramore, Orlando, FL D+71
- Colonicaltown North, Orlando, FL D+39
- College Park, Orlando, FL D+14
- South Orange, Orlando, FL D+17
- North Orange, Orlando, FL D+15
- Wadeview Park, Orlando, FL D+15
- Rio Grande Park, Orlando, FL D+49
- Mercy Drive, Orlando, FL D+72
- Baldwin Park, Orlando, FL D+10
- Tymber Skan on the Lake, Orlando, FL D+43
Neighborhoods with Similar Populations
- Elmwood Area, Abilene, TX R+25
- Bryant, Buffalo, NY D+68
- Greenville, Scarsdale, NY D+27
- Summit Hill, St. Paul, MN D+71
- Disston Heights, St. Petersburg, FL Even
- The Bush, Chicago, IL D+68
- Wellington-Harrington, Cambridge, MA D+72
- South Side, West Palm Beach, FL Even
- Hyde Park, Austin, TX D+71
- Bala Cynwyd, Bala-Cynwyd, PA D+48
Sources and methodology
Precinct-level voting records used to fit the model come from Florida Division of Elections, distributed by the Voting and Election Science Team. Demographic inputs come from the U.S. Census Bureau (ACS 5-year estimates and the 2020 Decennial Census). Health and environmental inputs come from the CDC (PLACES and the Environmental Justice Index). Land cover comes from the USGS and EPA. Election-day and lead-up weather come from PRISM 4km daily grids and the NOAA Global Historical Climatology Network. Mail-voting and election-administration patterns come from the MIT Election Lab's Survey of the Performance of American Elections. Block-group crime detail comes from CrimeGrade. Internet data and modeling support provided by ISPreports.org.
Modeling and analysis by the BestNeighborhood data science team. Full methodology and findings: political spectrum map.
Methodology reviewed by the BestNeighborhood data team. Last updated May 2026.