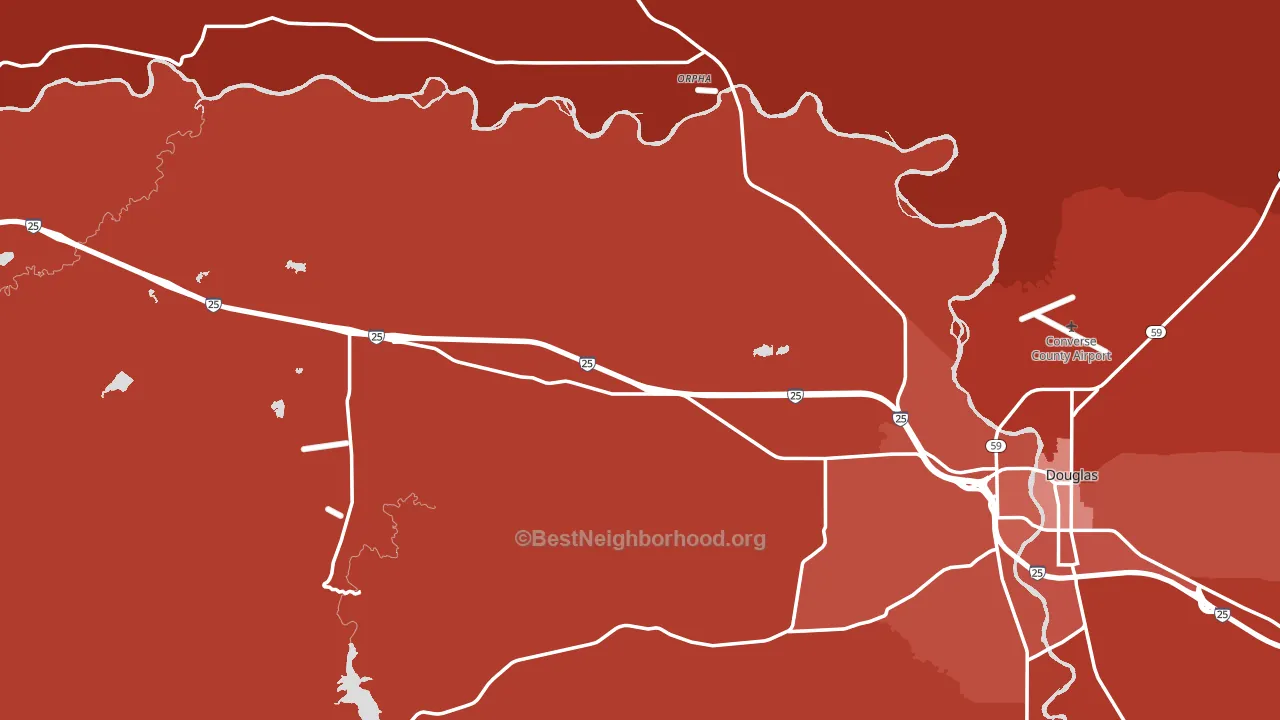
Converse County is a Republican stronghold. About 17% of voters here vote Democratic and 83% Republican.
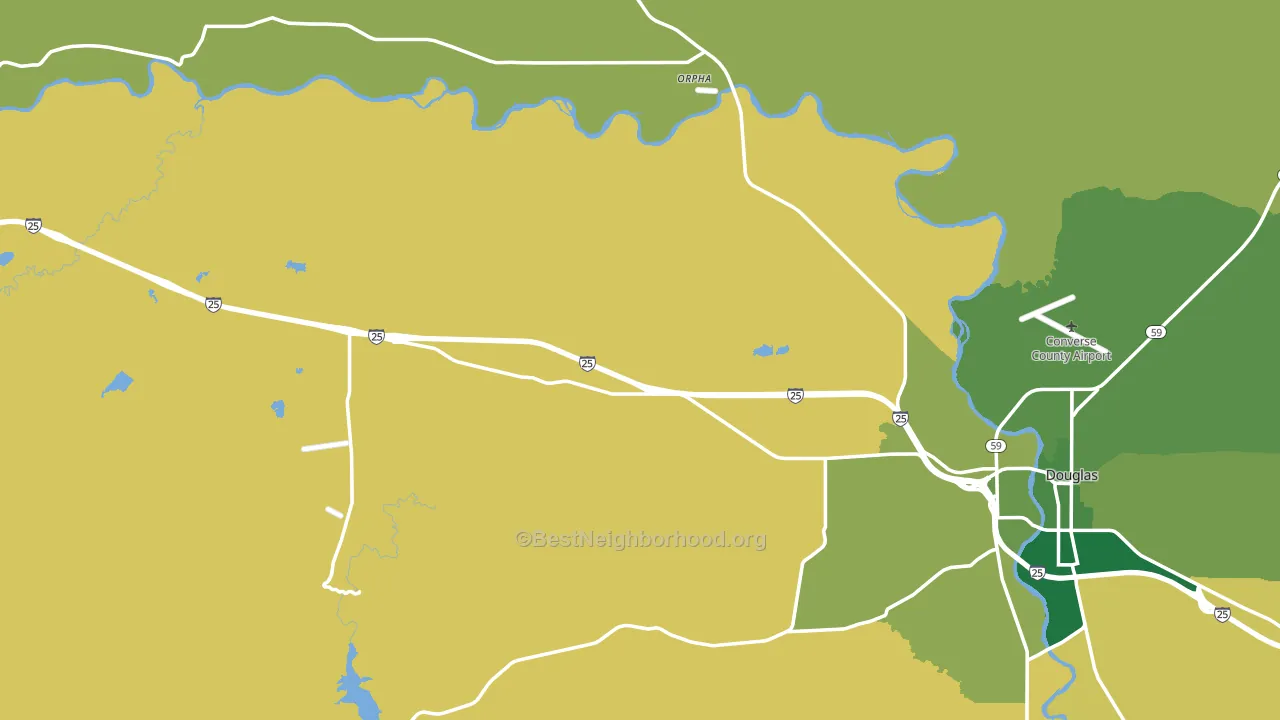
About 80% of adults in Converse County typically vote, above the U.S. average of about 62%. Among adults in Converse County, ~14% vote Democratic, ~66% Republican, and ~20% don't vote. The map below shows estimated turnout by block group.
How Converse County compares
Converse County runs about 20 points more Republican than Wyoming as a whole.
Politics vary noticeably by city within Converse County. The northwest side is the most Republican-leaning (R+77) and the west side is the least Republican-leaning (R+62), a spread of about 14 points.
Why Converse County leans the way it does
Density, race composition, education, and family structure all sit close to their national averages in Converse County. The lean here lands roughly where demographic data alone would predict.
Walkability and Democratic lean
Places with a highly walkable street grid tend to lean Democratic; Converse County, WY sits in the top quarter nationally on this measure. A walkable street grid does not change how people vote; it mostly reflects how urban a place is.
Why turnout in Converse County looks the way it does
Areas with high high-school completion turn out at higher rates. About 94% of adults in Converse County have completed high school, above 84% of counties. Learn more about the findings and methodology on the political spectrum map.
Nearby Counties
- Natrona County, WY R+41
- Niobrara County, WY R+90
- Platte County, WY R+65
- Goshen County, WY R+62
- Sioux County, NE R+79
- Weston County, WY R+68
- Campbell County, WY R+65
- Albany County, WY D+12
- Fall River County, SD R+52
- Carbon County, WY R+57
Counties with Similar Populations
- Winn Parish, LA R+44
- Washington County, IL R+53
- Morgan County, KY R+64
- Glacier County, MT D+32
- Breathitt County, KY R+62
- Chowan County, NC R+12
- Callahan County, TX R+69
- Morgan County, OH R+55
- Newton County, IN R+54
- Union County, KY R+56
Sources and methodology
Precinct-level voting records used to fit the model come from Wyoming Secretary of State, Elections, distributed by the Voting and Election Science Team. Demographic inputs come from the U.S. Census Bureau (ACS 5-year estimates and the 2020 Decennial Census). Health and environmental inputs come from the CDC (PLACES and the Environmental Justice Index). Land cover comes from the USGS and EPA. Election-day and lead-up weather come from PRISM 4km daily grids and the NOAA Global Historical Climatology Network. Mail-voting and election-administration patterns come from the MIT Election Lab's Survey of the Performance of American Elections. Block-group crime detail comes from CrimeGrade. Internet data and modeling support provided by ISPreports.org.
Modeling and analysis by the BestNeighborhood data science team. Full methodology and findings: political spectrum map.
Methodology reviewed by the BestNeighborhood data team. Last updated May 2026.