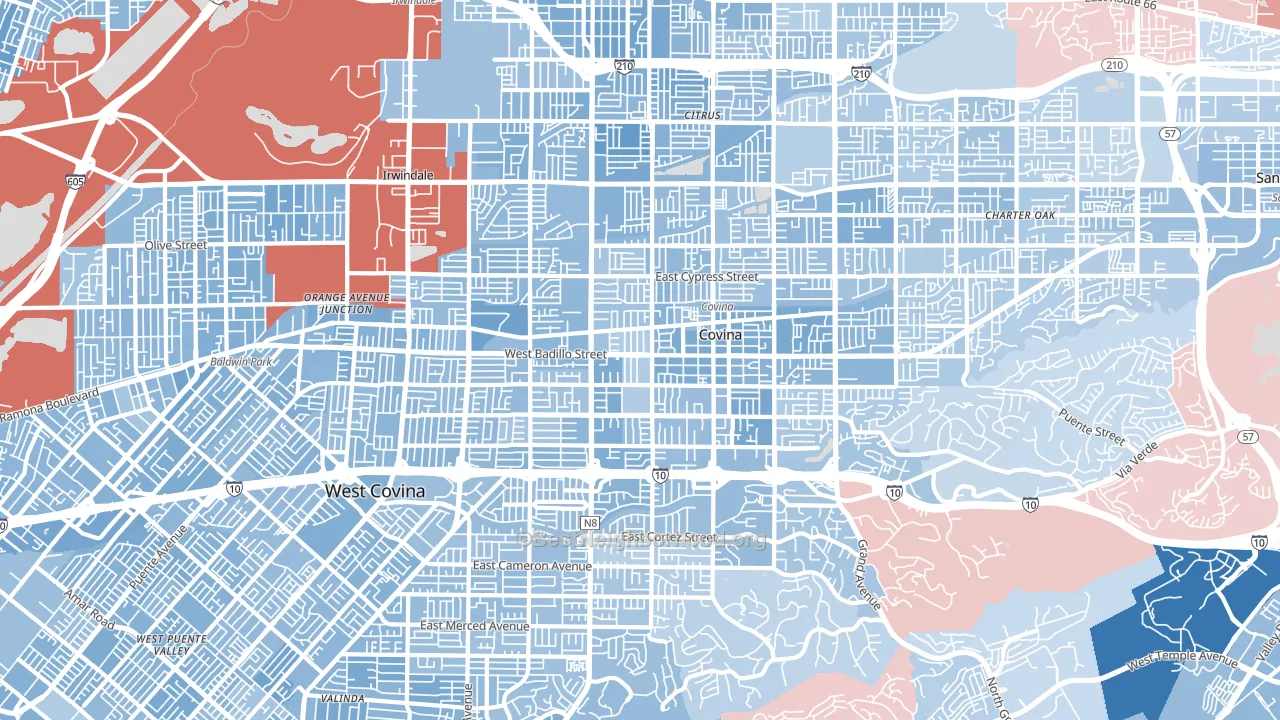
Covina-Valley leans Democratic by roughly 18 points: about 59% of voters vote Democratic and 41% Republican.
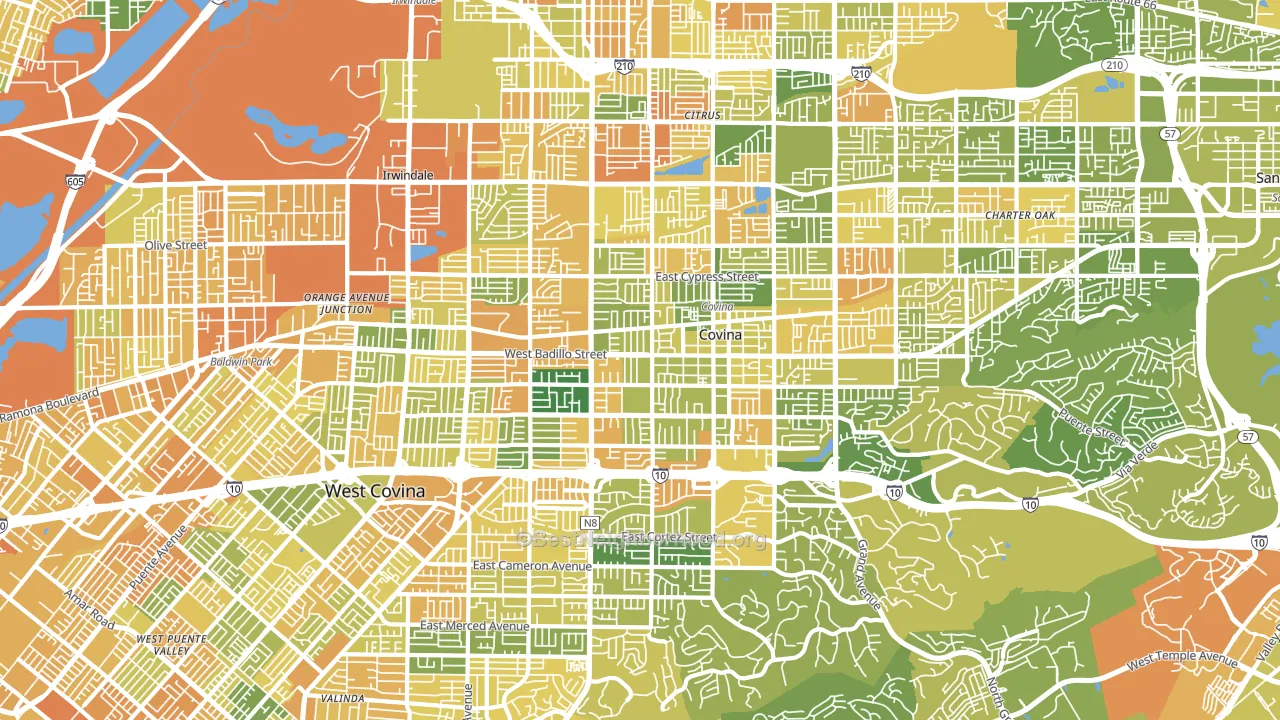
About 56% of adults in Covina-Valley typically vote, below the U.S. average of about 62%. Among adults in Covina-Valley, ~33% vote Democratic, ~23% Republican, and ~44% don't vote. The map below shows estimated turnout by block group.
How Covina-Valley compares
Politically, Covina-Valley sits close to the rest of California.
Politics vary noticeably by block within Covina-Valley. The northwest side is the most Democratic-leaning (D+22) and the southeast side is the least Democratic-leaning (D+8), a spread of about 14 points.
Why Covina-Valley leans the way it does
Density, race composition, education, and family structure all sit close to their national averages in Covina-Valley. The lean here lands roughly where demographic data alone would predict.
Population density and Democratic lean
Places with high population density tend to lean Democratic; Covina-Valley, Covina, CA sits in the top quarter nationally on this measure.
Why turnout in Covina-Valley looks the way it does
Crowded housing lines up with lower turnout. About 10% of homes in Covina-Valley have more than one occupant per room, above 90% of neighborhoods. Learn more about the findings and methodology on the political spectrum map.
Nearby Neighborhoods
- Charter Oak, Covina, CA D+9
- Bassett, West Puente Valley, CA D+31
- Walnut Valley, Diamond Bar, CA D+9
- Mayflower Village, Arcadia, CA D+14
- Mountain View, El Monte, CA D+28
- North El Monte, Arcadia, CA D+13
- Edison Historic District, Pomona, CA D+36
- Downtown Pomona, Pomona, CA D+36
- Valle Lindo, South El Monte, CA D+25
- East San Gabriel, San Gabriel, CA D+20
Neighborhoods with Similar Populations
- Northeast, Virginia Beach, VA D+5
- Sunnyside, Queens, NY D+36
- Estrella, Phoenix, AZ D+27
- Germantown, Philadelphia, PA D+87
- Greater Hilltop, Columbus, OH D+16
- Roxbury, Boston, MA D+65
- Rancho Penasquitos, San Diego, CA D+21
- Little Havana, Miami, FL R+15
- South East, Fort Worth, TX D+53
- Northwest, Anaheim, CA D+15
Sources and methodology
Precinct-level voting records used to fit the model come from California Secretary of State, Elections, distributed by the Voting and Election Science Team. Demographic inputs come from the U.S. Census Bureau (ACS 5-year estimates and the 2020 Decennial Census). Health and environmental inputs come from the CDC (PLACES and the Environmental Justice Index). Land cover comes from the USGS and EPA. Election-day and lead-up weather come from PRISM 4km daily grids and the NOAA Global Historical Climatology Network. Mail-voting and election-administration patterns come from the MIT Election Lab's Survey of the Performance of American Elections. Block-group crime detail comes from CrimeGrade. Internet data and modeling support provided by ISPreports.org.
Modeling and analysis by the BestNeighborhood data science team. Full methodology and findings: political spectrum map.
Methodology reviewed by the BestNeighborhood data team. Last updated May 2026.