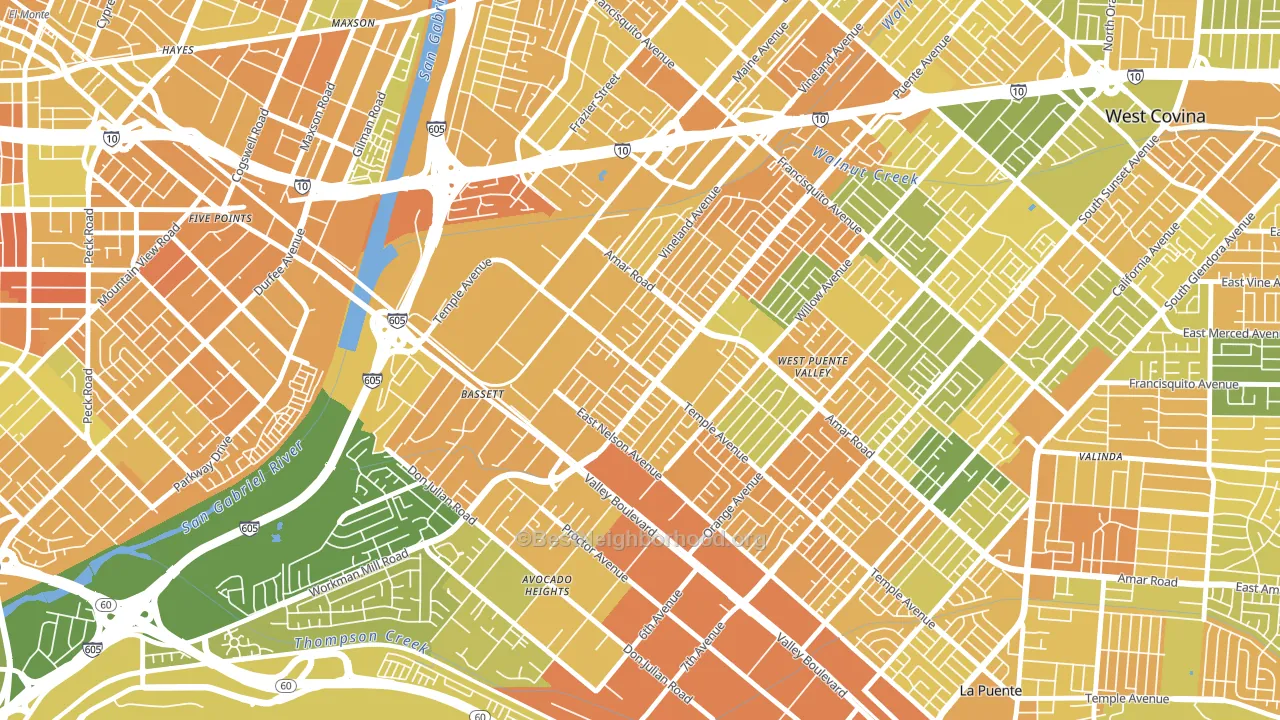
Bassett leans heavily Democratic by roughly 30 points: about 65% of voters vote Democratic and 35% Republican.
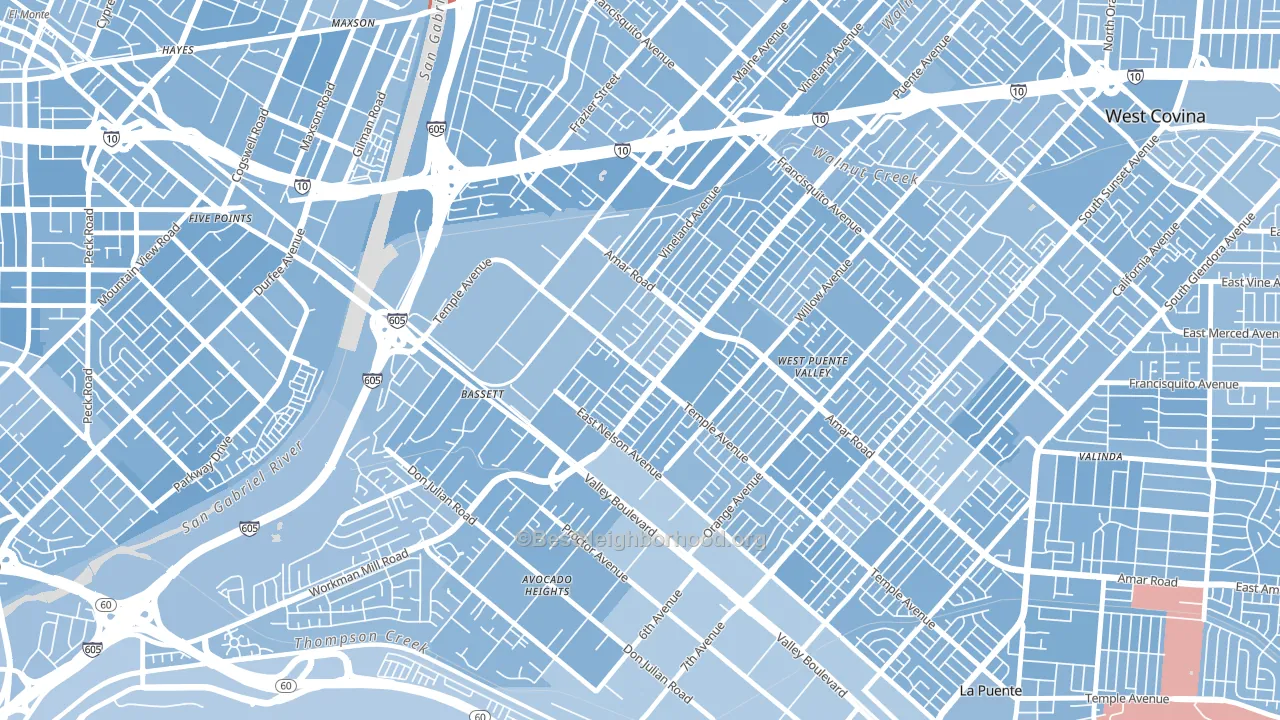
About 43% of adults in Bassett typically vote, below the U.S. average of about 62%. Among adults in Bassett, ~28% vote Democratic, ~15% Republican, and ~57% don't vote. The map below shows estimated turnout by block group.
How Bassett compares
Among neighborhoods within 5 miles, Bassett is the most Democratic-leaning.
Bassett runs about 11 points more Democratic than California as a whole.
Why Bassett leans the way it does
Density, race composition, education, and family structure all sit close to their national averages in Bassett. The lean here lands roughly where demographic data alone would predict.
Paved land cover and Democratic lean
Places with extensive paved surfaces tend to lean Democratic; Bassett, West Puente Valley, CA sits in the top quarter nationally on this measure. Paved ground does not change how people vote; it mostly reflects how urban and built-up a place is.
Why turnout in Bassett looks the way it does
Areas with limited routine healthcare access turn out at lower rates. Bassett is in the bottom quarter nationally for routine-care measures such as insurance coverage, preventive screenings, and dental visits. Crowded housing lines up with lower turnout, and about 18% of homes in Bassett have more than one occupant per room, above 98% of neighborhoods. Low high-school completion lines up with lower turnout, and about 69% of adults in Bassett have completed high school, below 95% of neighborhoods. Learn more about the findings and methodology on the political spectrum map.
Nearby Neighborhoods
- Mountain View, El Monte, CA D+28
- Valle Lindo, South El Monte, CA D+25
- North El Monte, Arcadia, CA D+13
- Mayflower Village, Arcadia, CA D+14
- Covina-Valley, Covina, CA D+18
- South San Gabriel, Rosemead, CA D+24
- Garvey, Rosemead, CA D+17
- East San Gabriel, San Gabriel, CA D+20
- El Rancho, Pico Rivera, CA D+29
- Los Neitos, West Whittier-Los Nietos, CA D+27
Neighborhoods with Similar Populations
- Save The Valley 21, El Paso, TX D+28
- Northwest, Portland, OR D+77
- Weston Ranch, Stockton, CA D+24
- Camp Pendleton South, Oceanside, CA R+25
- Maplewood-Ashcreek, Portland, OR D+61
- East Toledo, Toledo, OH D+15
- Ditmas Park, Brooklyn, NY D+69
- Airport, Honolulu, HI D+8
- Central, Boston, MA D+53
- Rockdale, Atlanta, GA D+58
Sources and methodology
Precinct-level voting records used to fit the model come from California Secretary of State, Elections, distributed by the Voting and Election Science Team. Demographic inputs come from the U.S. Census Bureau (ACS 5-year estimates and the 2020 Decennial Census). Health and environmental inputs come from the CDC (PLACES and the Environmental Justice Index). Land cover comes from the USGS and EPA. Election-day and lead-up weather come from PRISM 4km daily grids and the NOAA Global Historical Climatology Network. Mail-voting and election-administration patterns come from the MIT Election Lab's Survey of the Performance of American Elections. Block-group crime detail comes from CrimeGrade. Internet data and modeling support provided by ISPreports.org.
Modeling and analysis by the BestNeighborhood data science team. Full methodology and findings: political spectrum map.
Methodology reviewed by the BestNeighborhood data team. Last updated May 2026.