East San Gabriel leans Democratic by roughly 20 points: about 60% of voters vote Democratic and 40% Republican.
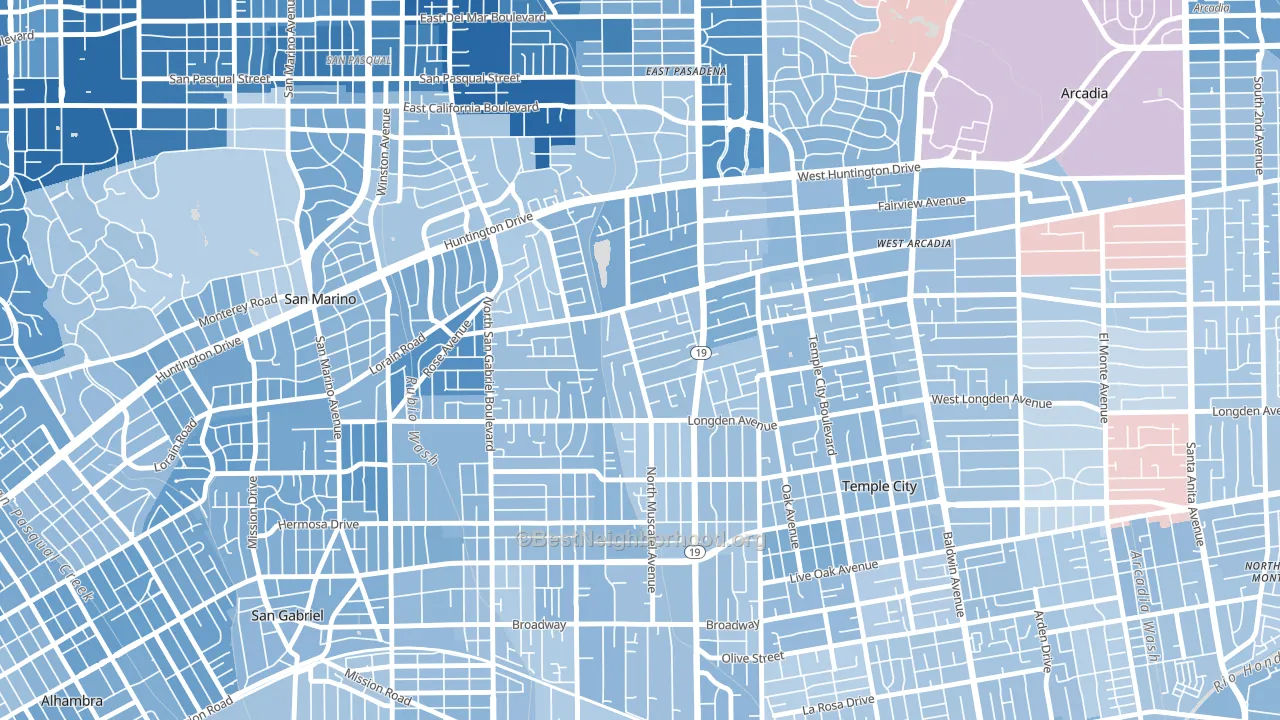
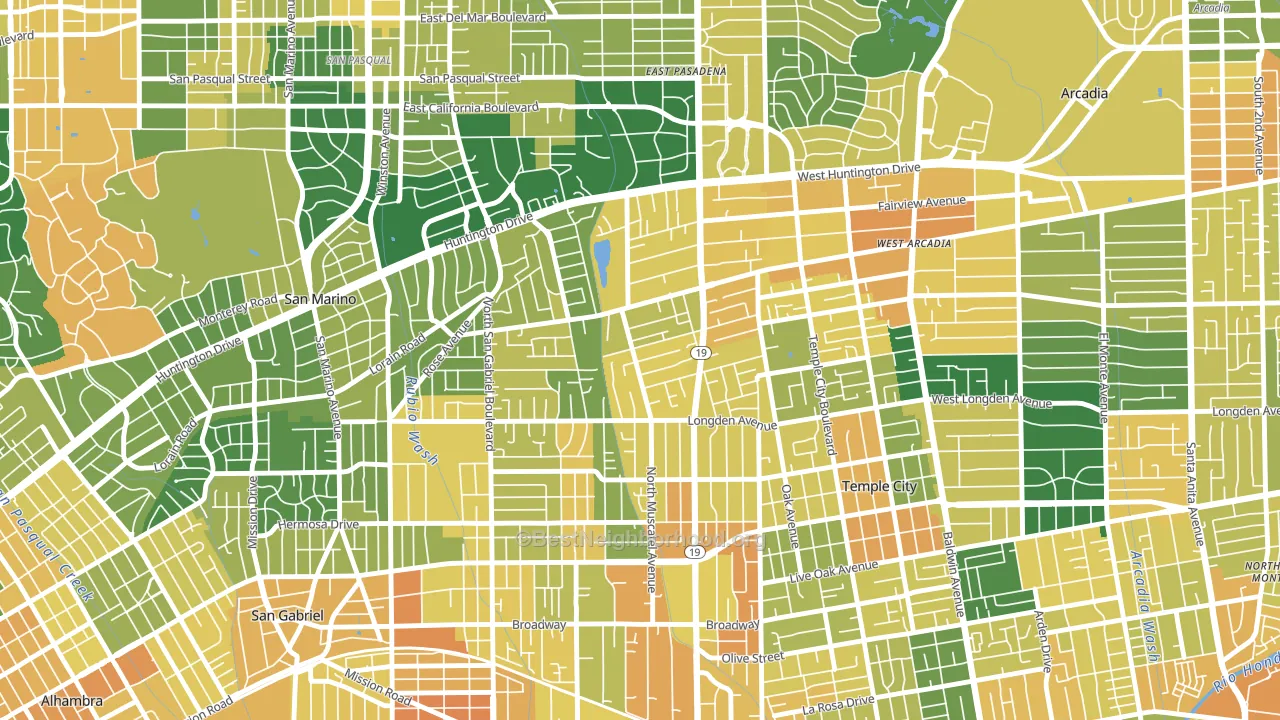
About 56% of adults in East San Gabriel typically vote, below the U.S. average of about 62%. Among adults in East San Gabriel, ~34% vote Democratic, ~23% Republican, and ~43% don't vote. The map below shows estimated turnout by block group.
How East San Gabriel compares
Among neighborhoods within 5 miles, East San Gabriel leans more Democratic than 3 of 10 neighbors.
Politically, East San Gabriel sits close to the rest of California.
Why East San Gabriel leans the way it does
This analysis examined 14,881 data points per neighborhood to find what predicts political lean and turnout. The items below are a few correlations that stood out for East San Gabriel, not a ranked or complete list of what matters most.
Density combined with diversity predicts Democratic voting. Non-Hispanic white share in East San Gabriel is about 16%, about 57 points below the U.S. average of 72%.
Population density and Democratic lean
Places with high population density tend to lean Democratic; East San Gabriel, San Gabriel, CA sits in the top quarter nationally on this measure.
Why turnout in East San Gabriel looks the way it does
Turnout in East San Gabriel sits close to the national pattern. Routine healthcare access, homeownership, education, and food security all land near their national averages here. Learn more about the findings and methodology on the political spectrum map.
Nearby Neighborhoods
- South East, Pasadena, CA D+56
- North East, Pasadena, CA D+24
- Mid Central, Pasadena, CA D+51
- North El Monte, Arcadia, CA D+13
- East Central, Pasadena, CA D+42
- Madison Heights, Pasadena, CA D+65
- Mayflower Village, Arcadia, CA D+14
- Garvey, Rosemead, CA D+17
- West Central, Pasadena, CA D+54
- South Arroyo, Pasadena, CA D+55
Neighborhoods with Similar Populations
- Franklin To The Fort, Missoula, MT D+29
- Downtown High Point, High Point, NC D+51
- Temple Crest, Tampa, FL D+48
- oakwood, Dayton, OH D+33
- Fairway Park, Hayward, CA D+36
- North Broadway, Escondido, CA Even
- St. Dennis, Louisville, KY D+39
- Wynken Blynken anchor Nod, Hialeah, FL R+43
- Carmel Mountain, San Diego, CA D+26
- Guajome, Oceanside, CA Even
Sources and methodology
Precinct-level voting records used to fit the model come from California Secretary of State, Elections, distributed by the Voting and Election Science Team. Demographic inputs come from the U.S. Census Bureau (ACS 5-year estimates and the 2020 Decennial Census). Health and environmental inputs come from the CDC (PLACES and the Environmental Justice Index). Land cover comes from the USGS and EPA. Election-day and lead-up weather come from PRISM 4km daily grids and the NOAA Global Historical Climatology Network. Mail-voting and election-administration patterns come from the MIT Election Lab's Survey of the Performance of American Elections. Block-group crime detail comes from CrimeGrade. Internet data and modeling support provided by ISPreports.org.
Modeling and analysis by the BestNeighborhood data science team. Full methodology and findings: political spectrum map.
Methodology reviewed by the BestNeighborhood data team. Last updated May 2026.