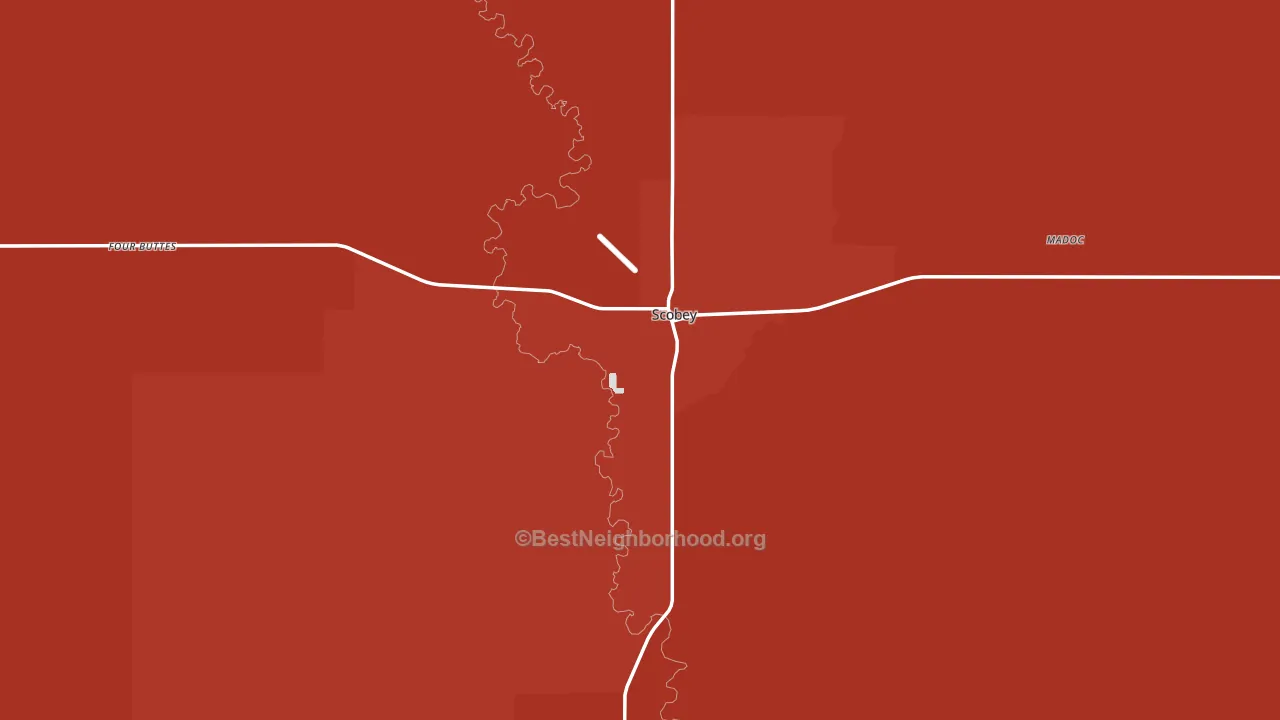
Daniels County is a Republican stronghold. About 17% of voters here vote Democratic and 83% Republican.
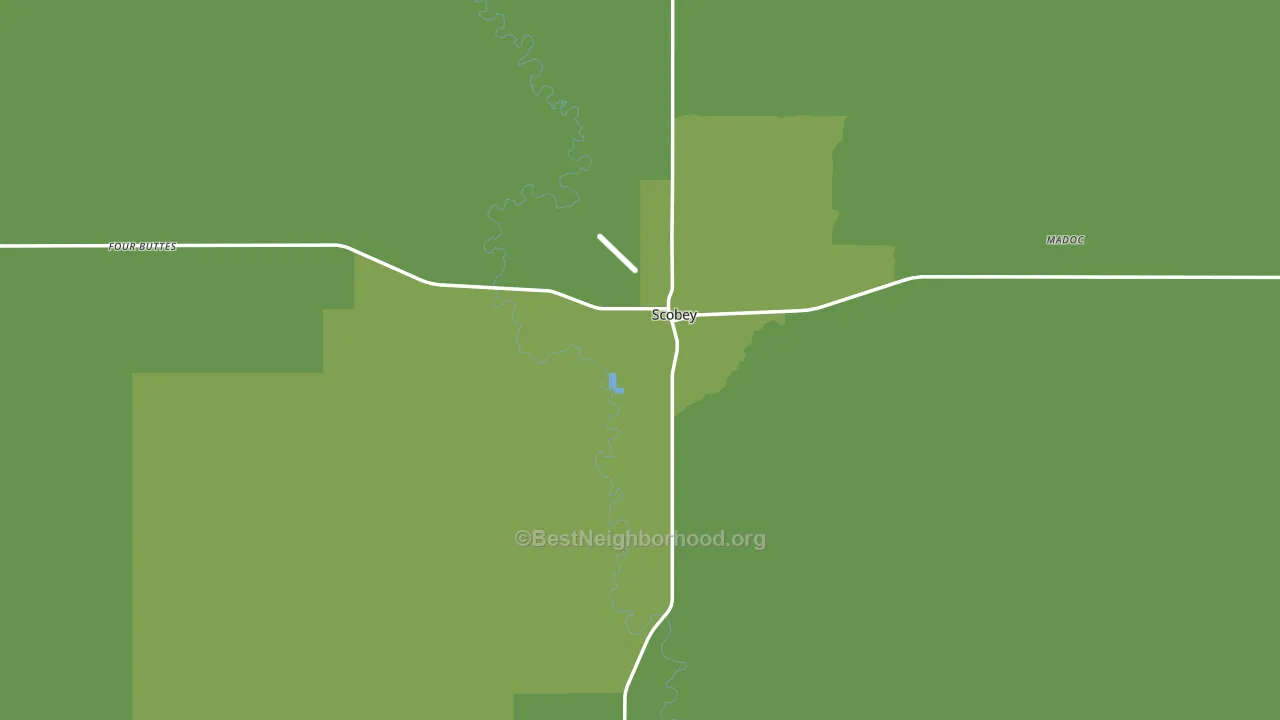
About 77% of adults in Daniels County typically vote, above the U.S. average of about 62%. Among adults in Daniels County, ~13% vote Democratic, ~64% Republican, and ~23% don't vote. The map below shows estimated turnout by block group.
How Daniels County compares
Daniels County sits in a sparsely populated area with few comparable counties nearby.
Daniels County runs about 46 points more Republican than Montana as a whole.
Why Daniels County leans the way it does
This analysis examined 14,881 data points per county to find what predicts political lean and turnout. The items below are a few correlations that stood out for Daniels County, not a ranked or complete list of what matters most.
Rural areas with a high white share vote Republican. Daniels County sits in the bottom quarter on density and about 90% of residents are non-Hispanic white, about 7 points above the Montana average of 83%.
Paved land cover and Republican lean
Places with little paved surface tend to lean Republican; Daniels County, MT sits in the bottom tenth nationally on this measure. Paved ground does not change how people vote; it mostly reflects how urban and built-up a place is.
Why turnout in Daniels County looks the way it does
Homeowners vote more often than renters. About 83% of households in Daniels County own their home, about 7 points above the Montana average of 77%. High high-school completion lines up with higher turnout, and about 95% of adults in Daniels County have completed high school, above 89% of counties. Learn more about the findings and methodology on the political spectrum map.
Nearby Counties
- Sheridan County, MT R+58
- Roosevelt County, MT Even
- Valley County, MT R+48
- McCone County, MT R+72
- Richland County, MT R+62
- Williams County, ND R+61
- Divide County, ND R+59
- Phillips County, MT R+52
- Dawson County, MT R+55
- McKenzie County, ND R+56
Counties with Similar Populations
- Jerauld County, SD R+48
- Dundy County, NE R+67
- Comanche County, KS R+73
- Powder River County, MT R+72
- De Baca County, NM R+35
- Denali Borough, AK R+37
- Hodgeman County, KS R+77
- McCone County, MT R+72
- Golden Valley County, ND R+69
- Lane County, KS R+78
Sources and methodology
Precinct-level voting records used to fit the model come from Montana Secretary of State, Elections, distributed by the Voting and Election Science Team. Demographic inputs come from the U.S. Census Bureau (ACS 5-year estimates and the 2020 Decennial Census). Health and environmental inputs come from the CDC (PLACES and the Environmental Justice Index). Land cover comes from the USGS and EPA. Election-day and lead-up weather come from PRISM 4km daily grids and the NOAA Global Historical Climatology Network. Mail-voting and election-administration patterns come from the MIT Election Lab's Survey of the Performance of American Elections. Block-group crime detail comes from CrimeGrade. Internet data and modeling support provided by ISPreports.org.
Modeling and analysis by the BestNeighborhood data science team. Full methodology and findings: political spectrum map.
Methodology reviewed by the BestNeighborhood data team. Last updated May 2026.