Debaliviere Place is a Democratic stronghold. About 91% of voters here vote Democratic and 9% Republican.
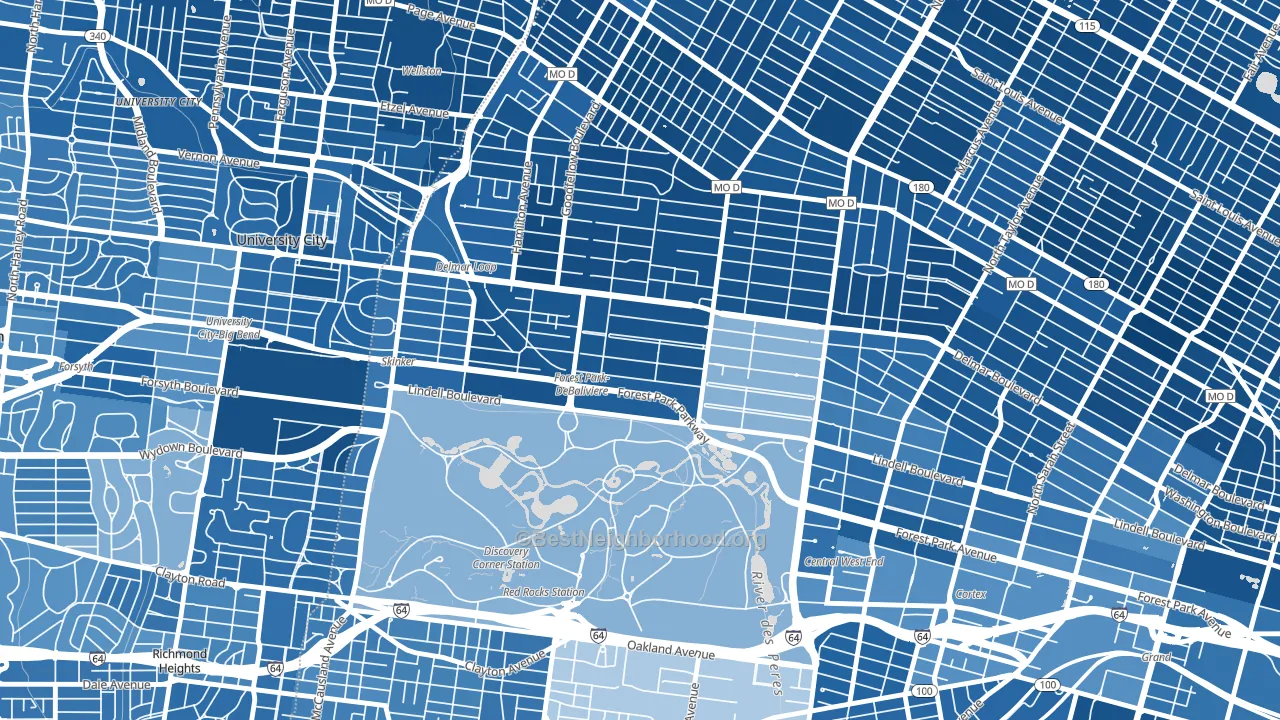
About 55% of adults in Debaliviere Place typically vote, below the U.S. average of about 62%. Among adults in Debaliviere Place, ~50% vote Democratic, ~5% Republican, and ~45% don't vote. The map below shows estimated turnout by block group.
How Debaliviere Place compares
Among neighborhoods within 5 miles, Debaliviere Place leans more Democratic than 24 of 31 neighbors.
Debaliviere Place runs about 99 points more Democratic than Missouri as a whole. Missouri leans Republican overall, while Debaliviere Place is one of the few Democratic-leaning pockets.
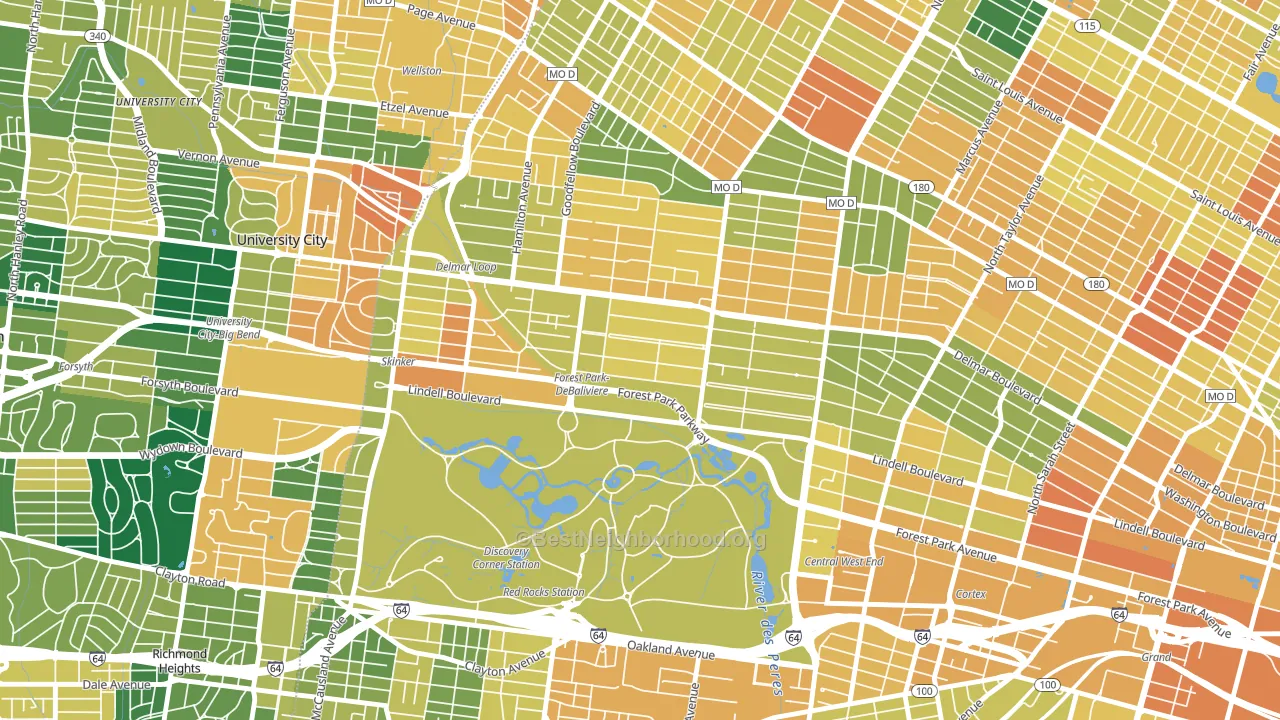
Politics vary noticeably by block within Debaliviere Place. The northwest side is the most Democratic-leaning (D+87) and the southeast side is the least Democratic-leaning (D+76), a spread of about 10 points.
Why Debaliviere Place leans the way it does
This analysis examined 14,881 data points per neighborhood to find what predicts political lean and turnout. The items below are a few correlations that stood out for Debaliviere Place, not a ranked or complete list of what matters most.
Areas with high college attainment vote Democratic. About 74% of adults in Debaliviere Place hold a bachelor's degree, about 45 points above the U.S. average of 28%. Dense areas vote Democratic, and Debaliviere Place sits in the top fifth on density (more than 99%, above 89% of neighborhoods). Debaliviere Place runs against the grain of Missouri, a Democratic-leaning pocket in a Republican-leaning state.
Walkability and Democratic lean
Places with a highly walkable street grid tend to lean Democratic; Debaliviere Place, St. Louis, MO sits in the top quarter nationally on this measure. A walkable street grid does not change how people vote; it mostly reflects how urban a place is.
Why turnout in Debaliviere Place looks the way it does
Renters vote less often than owners. About 72% of households in Debaliviere Place rent, about 47 points above the U.S. average of 25%. Strong routine healthcare access lines up with higher turnout, and Debaliviere Place sits in the top quarter on routine-care measures. Learn more about the findings and methodology on the political spectrum map.
Nearby Neighborhoods
- Skinker-Debaliviere, St. Louis, MO D+79
- West End, St. Louis, MO D+80
- Central West End, St. Louis, MO D+69
- Wells-Goodfellow, St. Louis, MO D+86
- Forest Park Southeast, St. Louis, MO D+73
- Franz Park, St. Louis, MO D+53
- The Greater Ville, St. Louis, MO D+87
- Grand Center, St. Louis, MO D+74
- Midtown St. Louis, St. Louis, MO D+71
- Southwest Garden, St. Louis, MO D+53
Neighborhoods with Similar Populations
- Nena, San Bernardino, CA D+5
- Dudgeon-Monroe, Madison, WI D+87
- Yalecrest, Salt Lake City, UT D+61
- New Hampshire Gardens, Takoma Park, MD D+78
- Wailea, Kihei, HI D+20
- Jackson Heights, Mobile, AL D+10
- North Richland, Richland, WA D+9
- Cleveland Heights, Lakeland, FL R+16
- Ol Sun, Clifton, CO R+30
- Reedy Creek, Richmond, VA D+70
Sources and methodology
Precinct-level voting records used to fit the model come from Missouri Secretary of State, Elections, distributed by the Voting and Election Science Team. Demographic inputs come from the U.S. Census Bureau (ACS 5-year estimates and the 2020 Decennial Census). Health and environmental inputs come from the CDC (PLACES and the Environmental Justice Index). Land cover comes from the USGS and EPA. Election-day and lead-up weather come from PRISM 4km daily grids and the NOAA Global Historical Climatology Network. Mail-voting and election-administration patterns come from the MIT Election Lab's Survey of the Performance of American Elections. Block-group crime detail comes from CrimeGrade. Internet data and modeling support provided by ISPreports.org.
Modeling and analysis by the BestNeighborhood data science team. Full methodology and findings: political spectrum map.
Methodology reviewed by the BestNeighborhood data team. Last updated May 2026.