Forest Park Southeast is a Democratic stronghold. About 86% of voters here vote Democratic and 14% Republican.
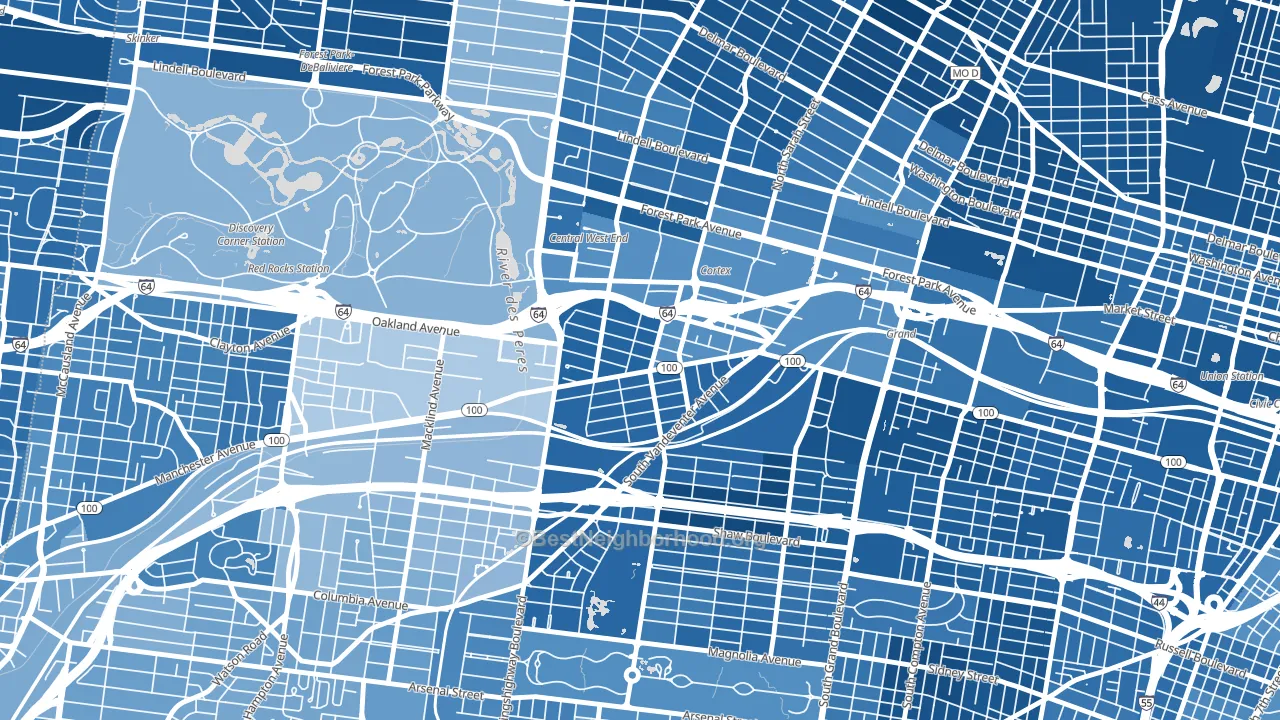
About 48% of adults in Forest Park Southeast typically vote, below the U.S. average of about 62%. Among adults in Forest Park Southeast, ~41% vote Democratic, ~7% Republican, and ~52% don't vote. The map below shows estimated turnout by block group.
How Forest Park Southeast compares
Among neighborhoods within 5 miles, Forest Park Southeast leans more Democratic than 21 of 36 neighbors.
Forest Park Southeast runs about 91 points more Democratic than Missouri as a whole. Missouri leans Republican overall, while Forest Park Southeast is one of the few Democratic-leaning pockets.
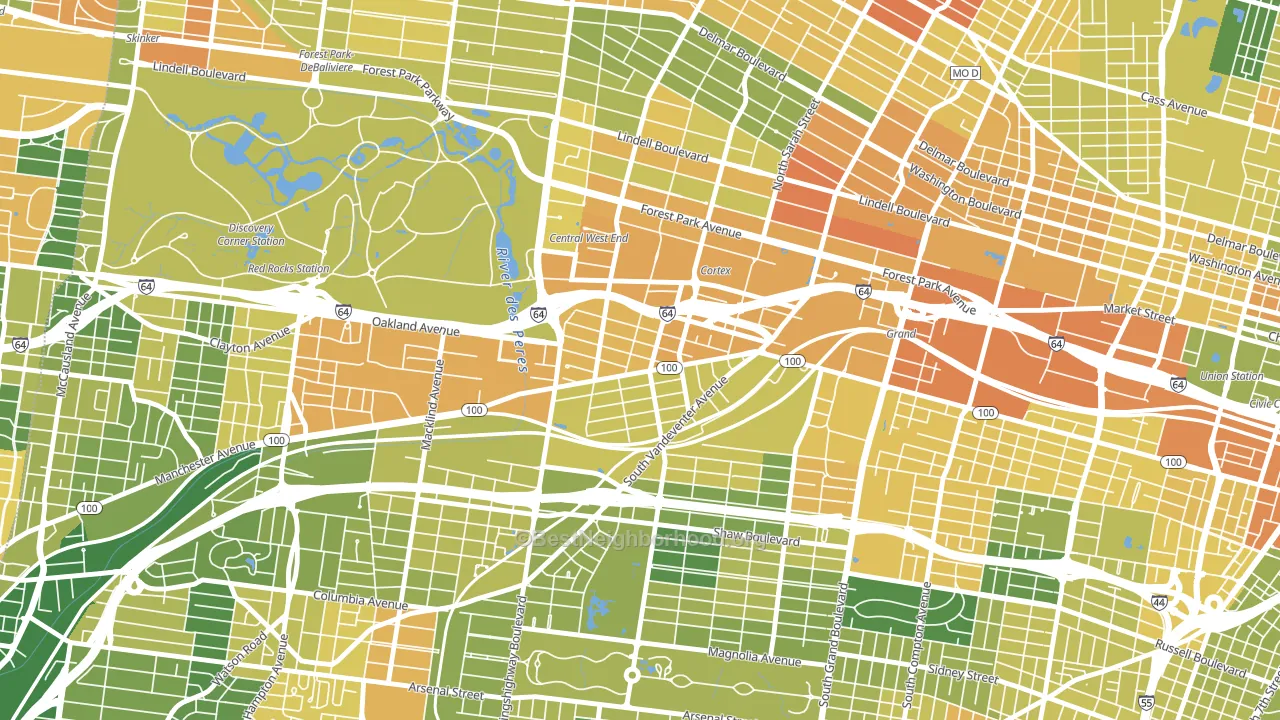
Politics vary noticeably by block within Forest Park Southeast. The south side is the most Democratic-leaning (D+76) and the northeast side is the least Democratic-leaning (D+63), a spread of about 13 points.
Why Forest Park Southeast leans the way it does
This analysis examined 14,881 data points per neighborhood to find what predicts political lean and turnout. The items below are a few correlations that stood out for Forest Park Southeast, not a ranked or complete list of what matters most.
Dense areas vote Democratic. More than 99% of residents in Forest Park Southeast live in densely developed areas, about 64 points above the U.S. average of 36%. High college attainment predicts Democratic voting, and Forest Park Southeast sits in the top quarter (about 63%, above 83% of neighborhoods). Forest Park Southeast runs against the grain of Missouri, a Democratic-leaning pocket in a Republican-leaning state.
Paved land cover and Democratic lean
Places with extensive paved surfaces tend to lean Democratic; Forest Park Southeast, St. Louis, MO sits in the top tenth nationally on this measure. Paved ground does not change how people vote; it mostly reflects how urban and built-up a place is.
Why turnout in Forest Park Southeast looks the way it does
Renters vote less often than owners. About 67% of households in Forest Park Southeast rent, about 42 points above the U.S. average of 25%. High-crime urban areas turn out at lower rates, and Forest Park Southeast sits in the top 15% on a violent-crime measure. Learn more about the findings and methodology on the political spectrum map.
Nearby Neighborhoods
- Central West End, St. Louis, MO D+69
- Shaw, St. Louis, MO D+75
- Midtown St. Louis, St. Louis, MO D+71
- Southwest Garden, St. Louis, MO D+53
- Grand Center, St. Louis, MO D+74
- The Gate District, St. Louis, MO D+75
- Debaliviere Place, St. Louis, MO D+81
- Tower Grove East, St. Louis, MO D+76
- Tower Grove South, St. Louis, MO D+65
- Clifton Heights, St. Louis, MO D+36
Neighborhoods with Similar Populations
- El Cerrito, Corona, CA R+18
- Lovisa Farms, Pasco, WA R+23
- Skunk City, Syracuse, NY D+46
- Lasalle College Park, Detroit, MI D+87
- Downtown Hilo, Hilo, HI D+33
- International, San Bernardino, CA D+28
- Westhaven Trails, Madison, WI D+65
- Forest Glen, Arlington, VA D+43
- Winsor Hills, Baltimore, MD D+87
- East Harriet, Minneapolis, MN D+76
Sources and methodology
Precinct-level voting records used to fit the model come from Missouri Secretary of State, Elections, distributed by the Voting and Election Science Team. Demographic inputs come from the U.S. Census Bureau (ACS 5-year estimates and the 2020 Decennial Census). Health and environmental inputs come from the CDC (PLACES and the Environmental Justice Index). Land cover comes from the USGS and EPA. Election-day and lead-up weather come from PRISM 4km daily grids and the NOAA Global Historical Climatology Network. Mail-voting and election-administration patterns come from the MIT Election Lab's Survey of the Performance of American Elections. Block-group crime detail comes from CrimeGrade. Internet data and modeling support provided by ISPreports.org.
Modeling and analysis by the BestNeighborhood data science team. Full methodology and findings: political spectrum map.
Methodology reviewed by the BestNeighborhood data team. Last updated May 2026.