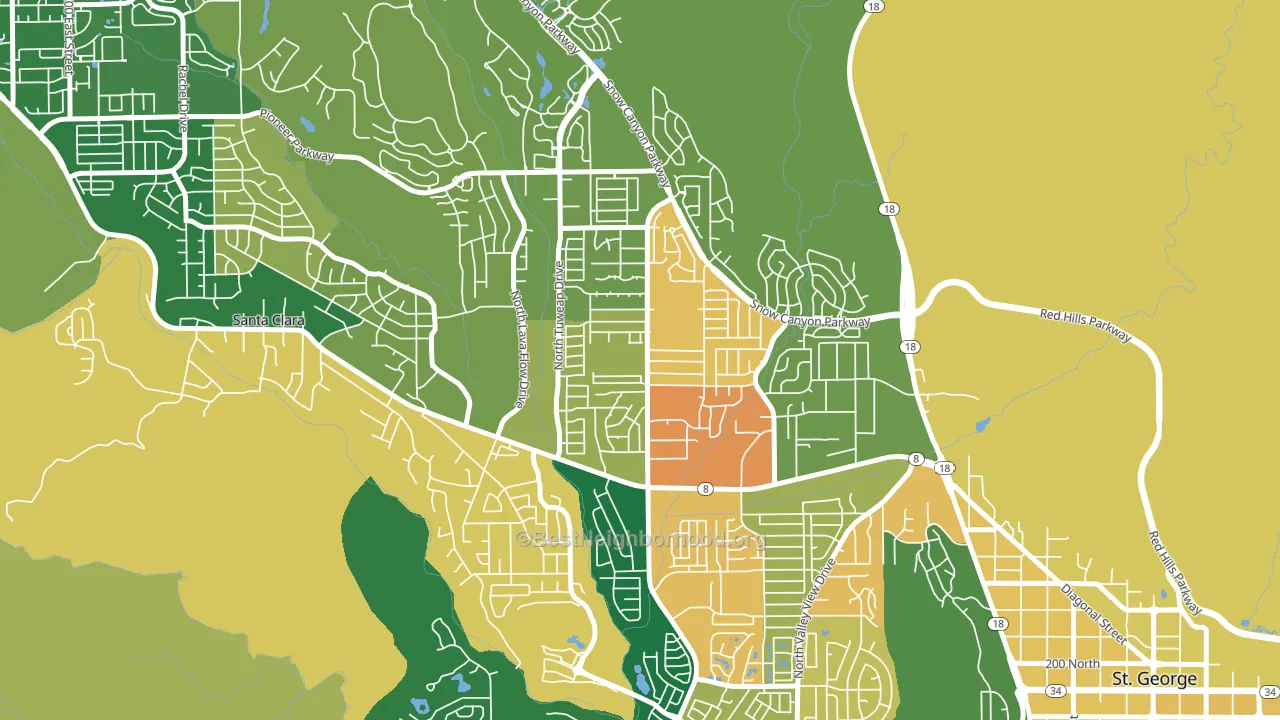
Dixie Downs leans Republican by roughly 30 points: about 35% of voters vote Democratic and 65% Republican.
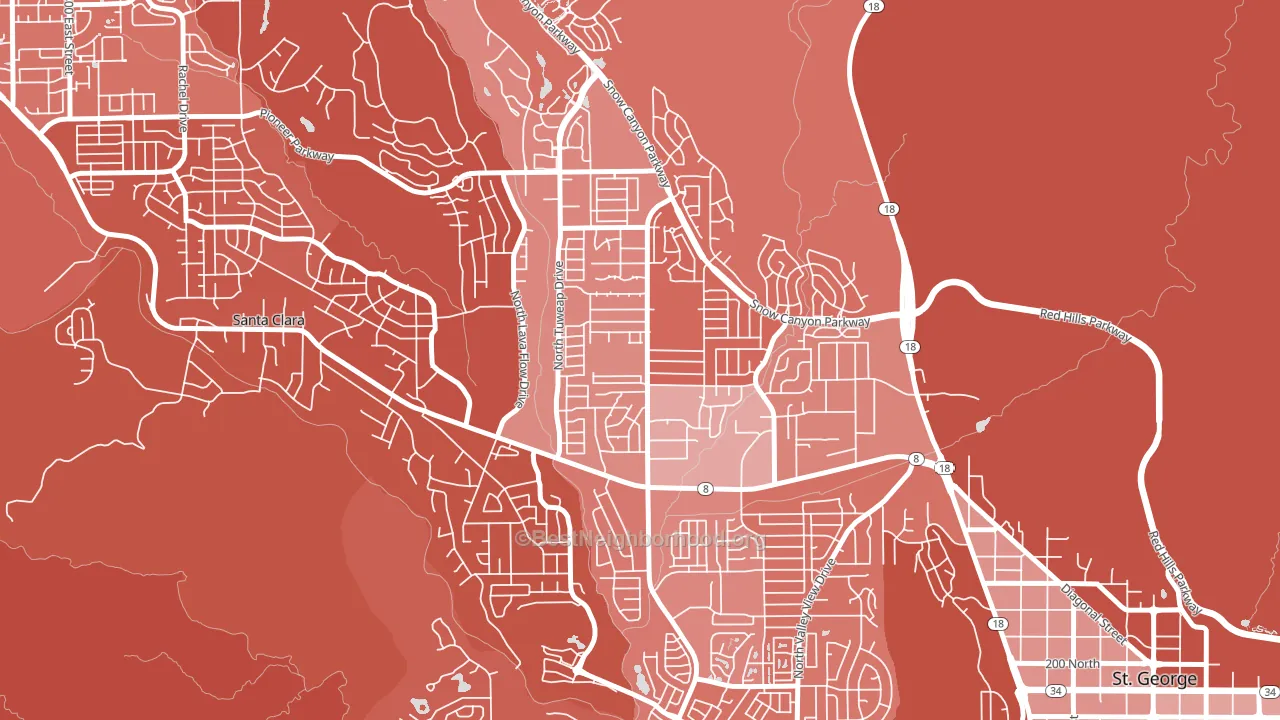
About 60% of adults in Dixie Downs typically vote, near the U.S. average of about 62%. Among adults in Dixie Downs, ~21% vote Democratic, ~39% Republican, and ~40% don't vote. The map below shows estimated turnout by block group.
How Dixie Downs compares
Dixie Downs runs about 8 points more Republican than Utah as a whole.
Why Dixie Downs leans the way it does
Density, race composition, education, and family structure all sit close to their national averages in Dixie Downs. The lean here lands roughly where demographic data alone would predict.
Walkability and Republican lean
Places with a low walkability score tend to lean Republican; Dixie Downs, St. George, UT sits below the national average on this measure. A walkable street grid does not change how people vote; it mostly reflects how urban a place is.
Why turnout in Dixie Downs looks the way it does
Crowded housing lines up with lower turnout. About 7% of homes in Dixie Downs have more than one occupant per room, above 86% of neighborhoods. Learn more about the findings and methodology on the political spectrum map.
Nearby Neighborhoods
- Santa Clara Heights, Santa Clara, UT R+56
- Calico Ridge, Henderson, NV R+4
- Sunrise, Las Vegas, NV D+26
- North Last Vegas, North Las Vegas, NV D+23
- East Las Vegas, Las Vegas, NV D+30
- Sheep Mountain, Las Vegas, NV R+12
- Foothills, Henderson, NV R+17
- Pittman, Henderson, NV D+5
- Valley View, Henderson, NV D+3
- Cultural Corridor, Las Vegas, NV D+34
Neighborhoods with Similar Populations
- The West Side, Eureka, CA D+37
- Fort Concho, San Angelo, TX R+14
- Northside, Kalamazoo, MI D+79
- Pawtuckett, Charlotte, NC D+46
- North Central Thousand Oaks, San Antonio, TX Even
- Perris Hills, San Bernardino, CA D+26
- Lakeside-Lester Park, Duluth, MN D+39
- Old Savannah, Augusta, GA D+40
- Central East Austin, Austin, TX D+64
- Hansen, Mountain House, CA D+15
Sources and methodology
Precinct-level voting records used to fit the model come from Utah Lieutenant Governor's Office, Elections, distributed by the Voting and Election Science Team. Demographic inputs come from the U.S. Census Bureau (ACS 5-year estimates and the 2020 Decennial Census). Health and environmental inputs come from the CDC (PLACES and the Environmental Justice Index). Land cover comes from the USGS and EPA. Election-day and lead-up weather come from PRISM 4km daily grids and the NOAA Global Historical Climatology Network. Mail-voting and election-administration patterns come from the MIT Election Lab's Survey of the Performance of American Elections. Block-group crime detail comes from CrimeGrade. Internet data and modeling support provided by ISPreports.org.
Modeling and analysis by the BestNeighborhood data science team. Full methodology and findings: political spectrum map.
Methodology reviewed by the BestNeighborhood data team. Last updated May 2026.